


Bitcoin BTC/USD was sliding about 2.5% lower during Friday’s 24-hour trading session as the crypto continued to give back part of the 6.8% rise that occurred between Monday and Tuesday.
Ethereum ETH/USD followed suit, declining about 1.5%, while Dogecoin DOGE/USD, which has been more closely following Bitcoin’s direction over the course of the week, was trading down about 2.6%.
The decline in the crypto sector is in tandem with the S&P 500, which was suffering a very bearish day, plunging 2.8%.
Although the crypto sector has shown comparative strength against the general market over recent weeks, the price action in Bitcoin, Ethereum and Dogecoin will be watched closely over the course of the weekend to provide clues as to how the general market may behave next week.
Here’s a look at the three cryptos:
Want direct analysis? Find me in the BZ Pro lounge! Click here for a free trial
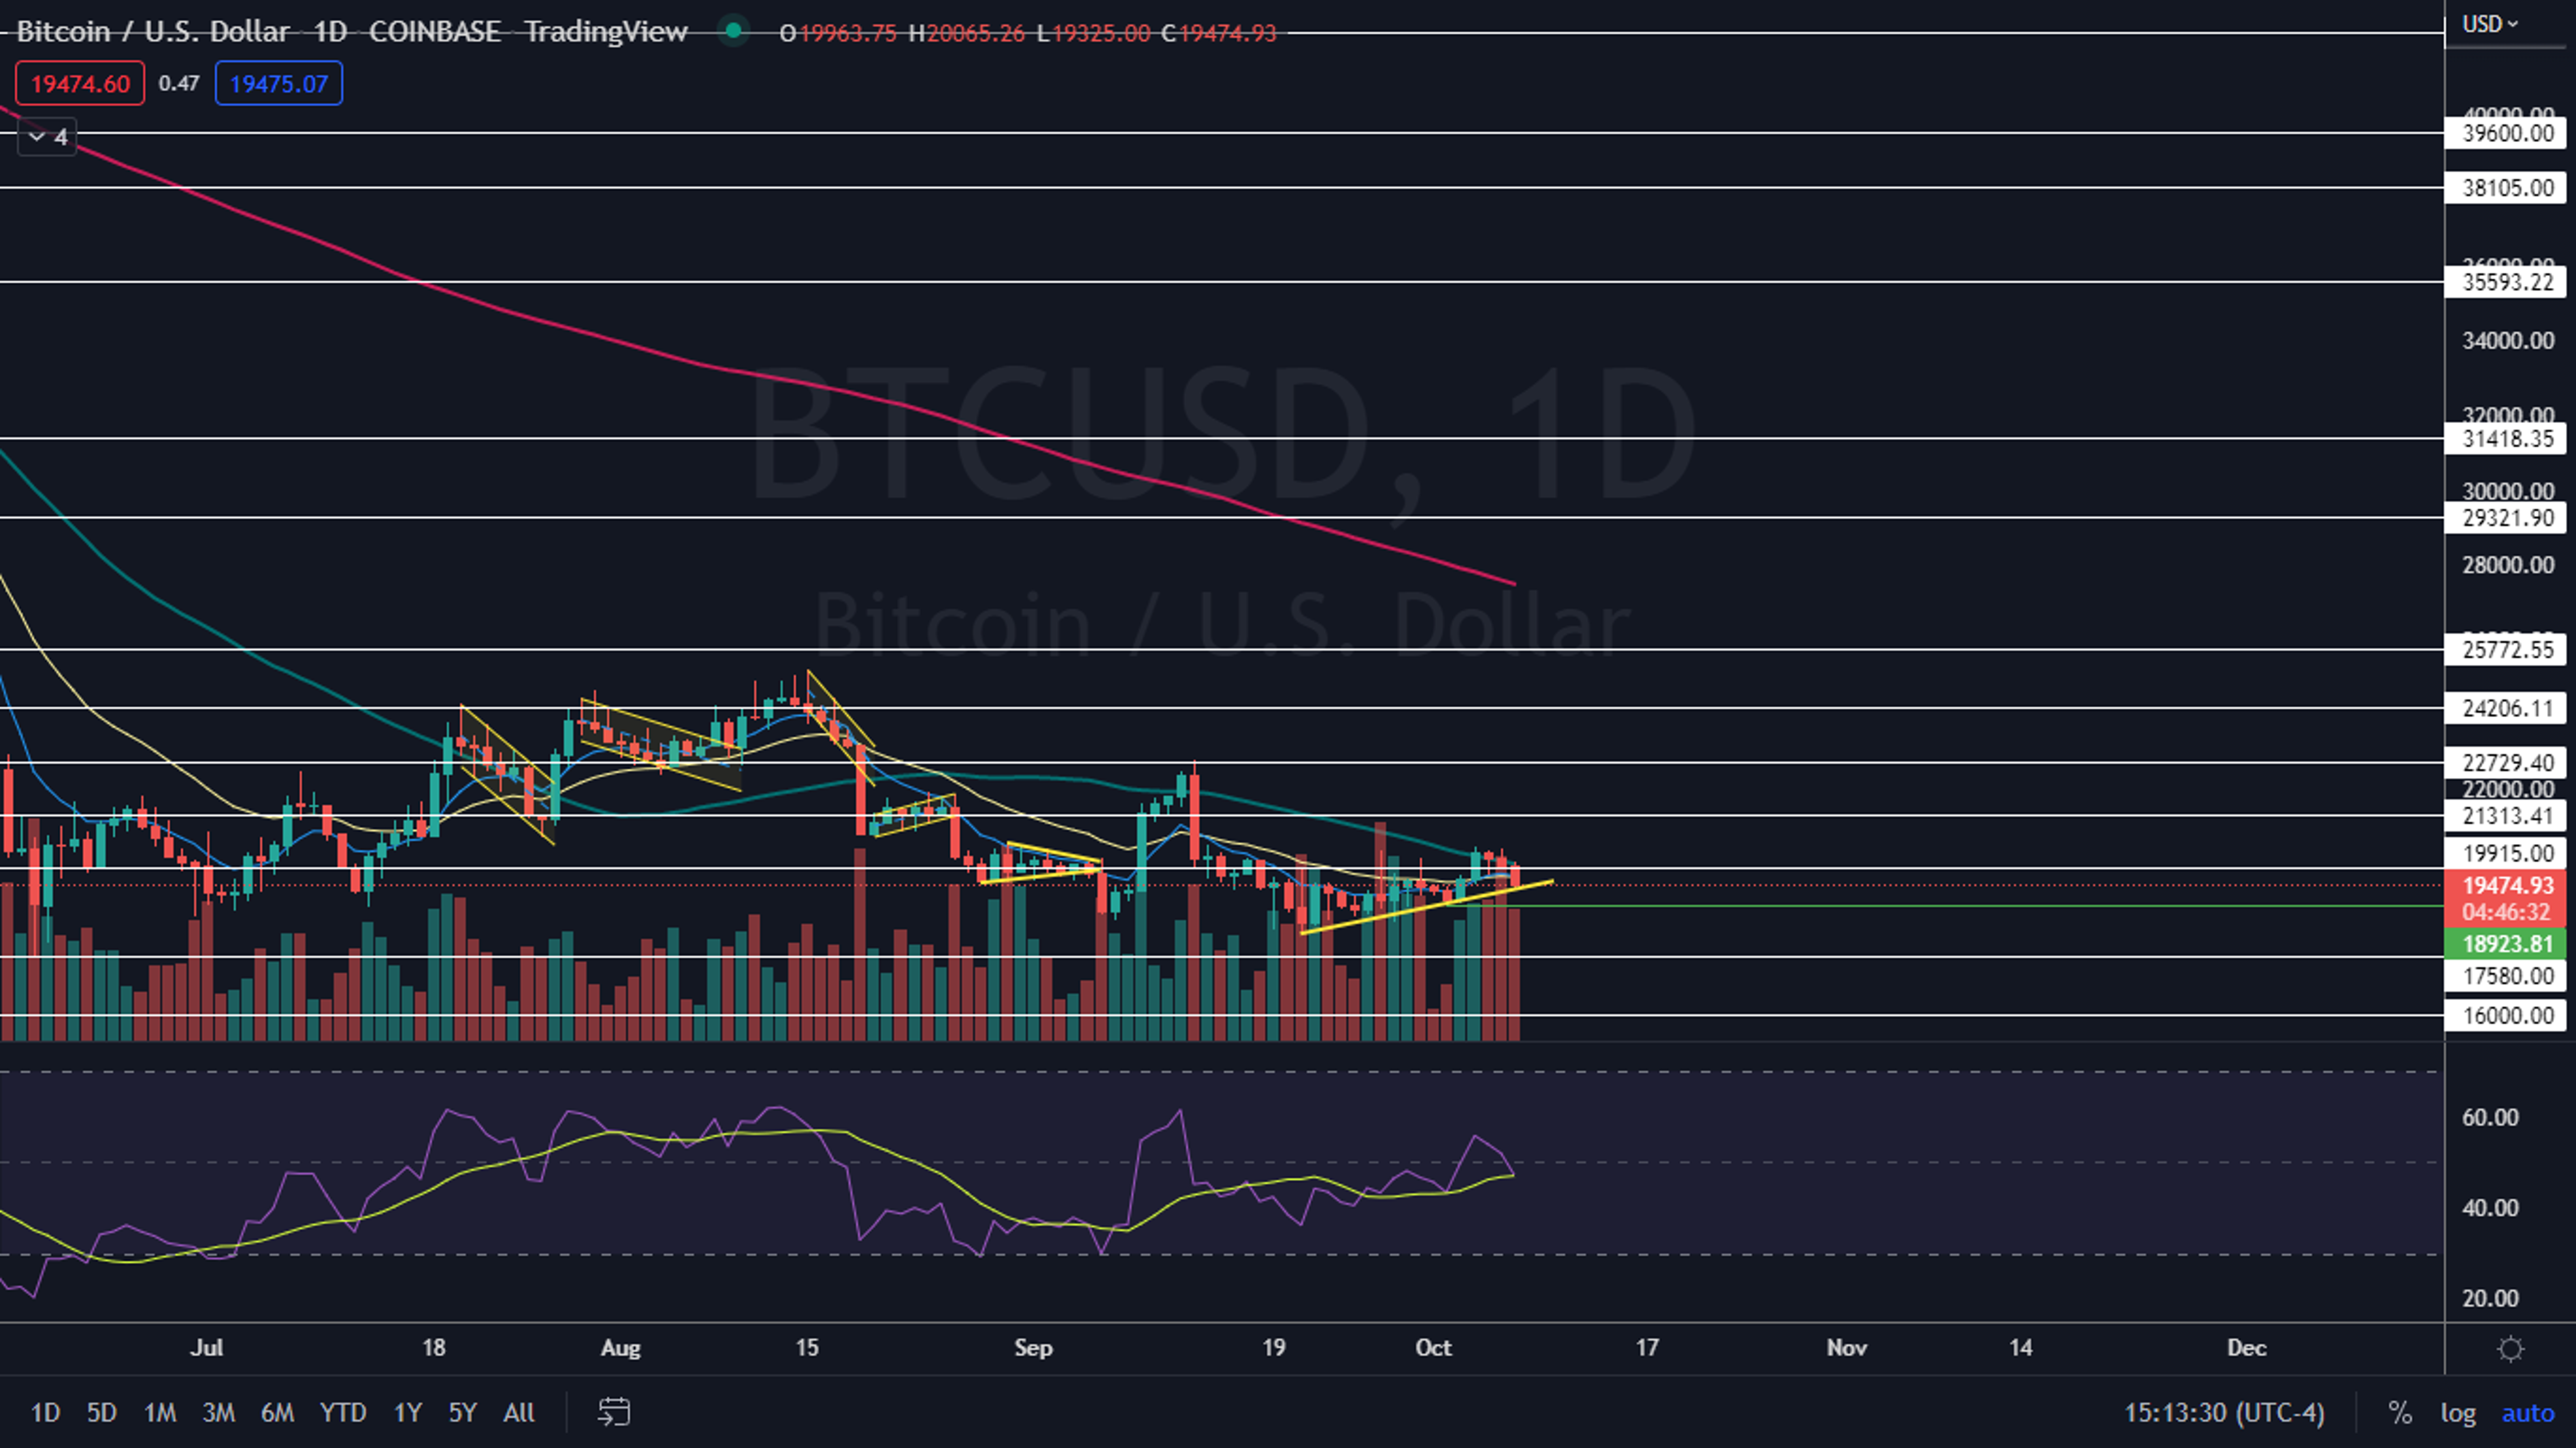
The Bitcoin Chart: Despite trading lower for the third 24-hour trading period in a row, Bitcoin was holding above an ascending trendline on Friday afternoon, which has been guiding the crypto within an uptrend on the daily chart.
Bitcoin’s most recent higher high was printed on Tuesday at $20,479.93 and the most recent higher low was formed at the $18,923.81 mark on Oct. 2. If Bitcoin falls under the lower ascending trendline, bullish traders will want to see the crypto form a bullish reversal candlestick above that higher low, otherwise the uptrend will be negated.
Bitcoin has resistance above at $19,915 and $21,313.41 and support below at $17,580 and $16,000.

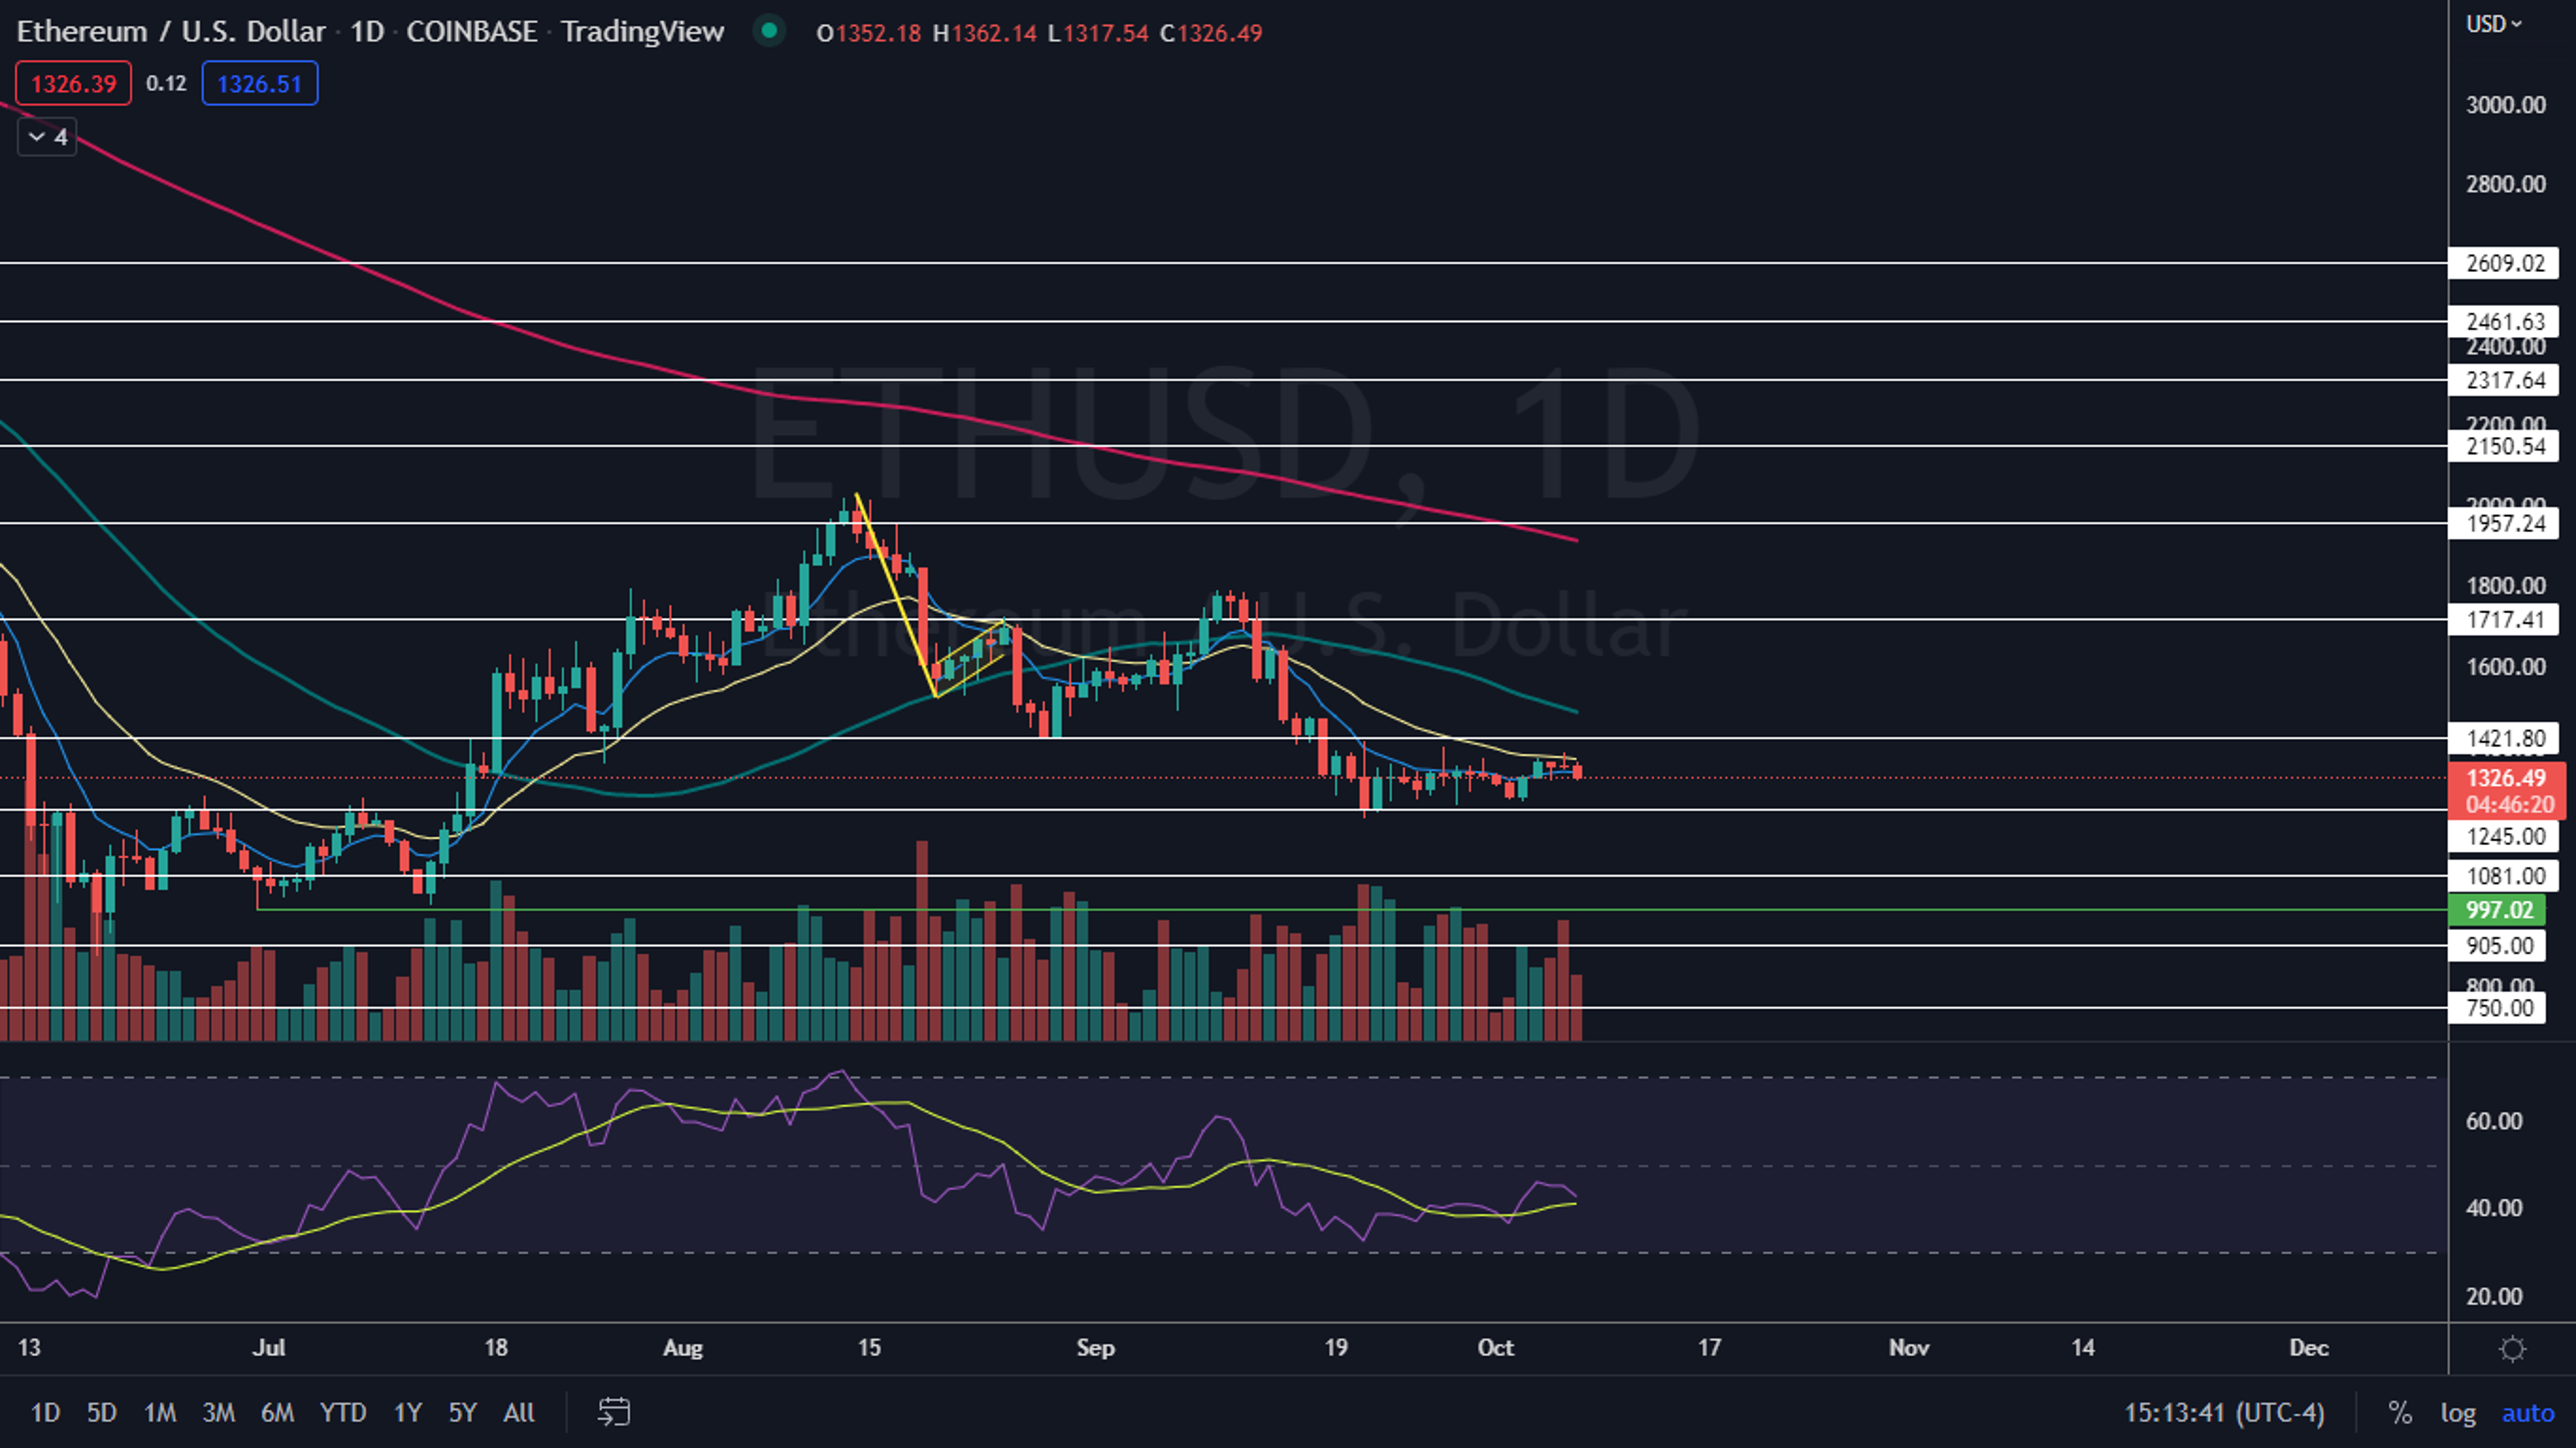
Overall, Ethereum’s trading volume has been declining since Sept. 18. This indicates the crypto is either in a consolidation or distribution phase and traders and investors can watch for either big bearish volume or big bullish volume to eventually come in and break Ethereum up or down from the sideways pattern to indicate future direction.
Ethereum has resistance above at $1,421.80 and $1,717,41 and support below at $1,245 and $1,081.
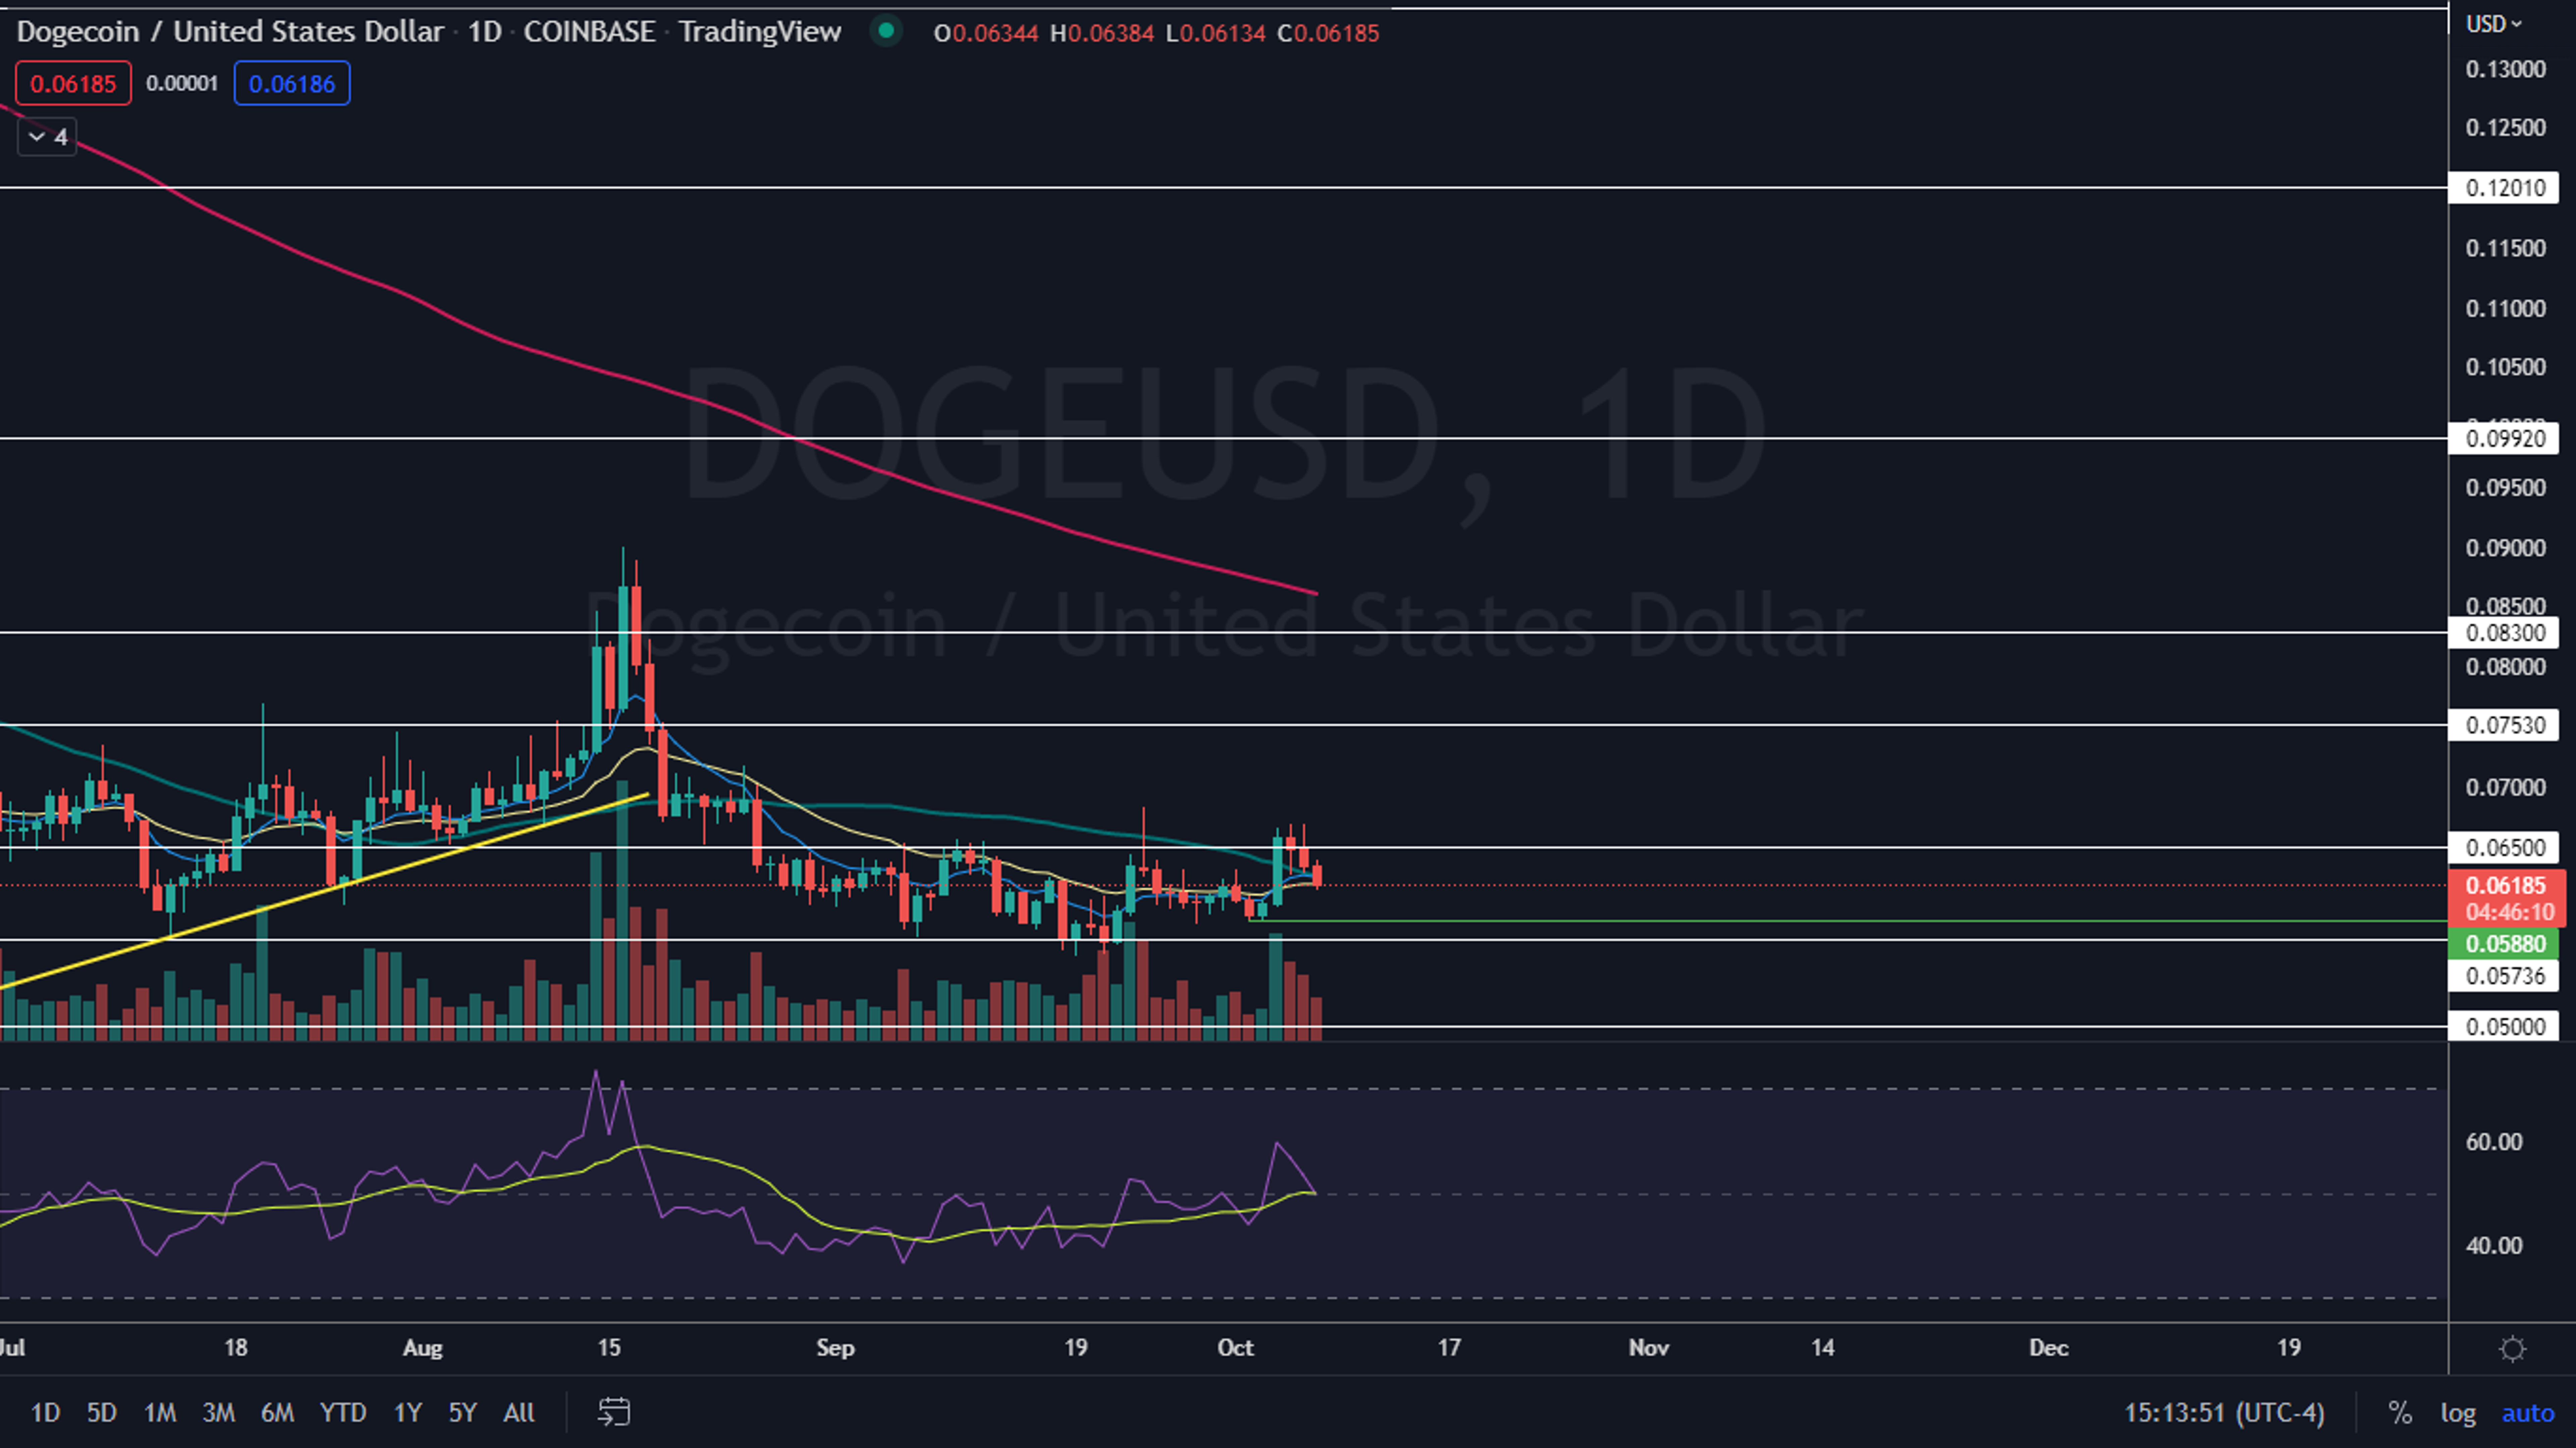
Because Dogecoin formed its most recent higher high and most recent higher low over four consecutive days, a double bottom and a double top pattern have formed on the crypto’s chart. Bullish traders will want to see Dogecoin shoot up above the most recent higher high over the coming days to indicate the uptrend will continue.
Bearish traders will want to see the stock fall below the most recent lower high or for the crypto to rise and form a triple top pattern at $0.0668.
Dogecoin has resistance above at $0.065 and $0.075 and support below at $0.057 and at 5 cents.
© 2024 Benzinga.com. Benzinga does not provide investment advice. All rights reserved.
Trade confidently with insights and alerts from analyst ratings, free reports and breaking news that affects the stocks you care about.

