
Bitcoin BTC/USD was plunging about 7% on Thursday after a brief rebound on Wednesday caused the crypto to bounce up almost 13% off the low of day.
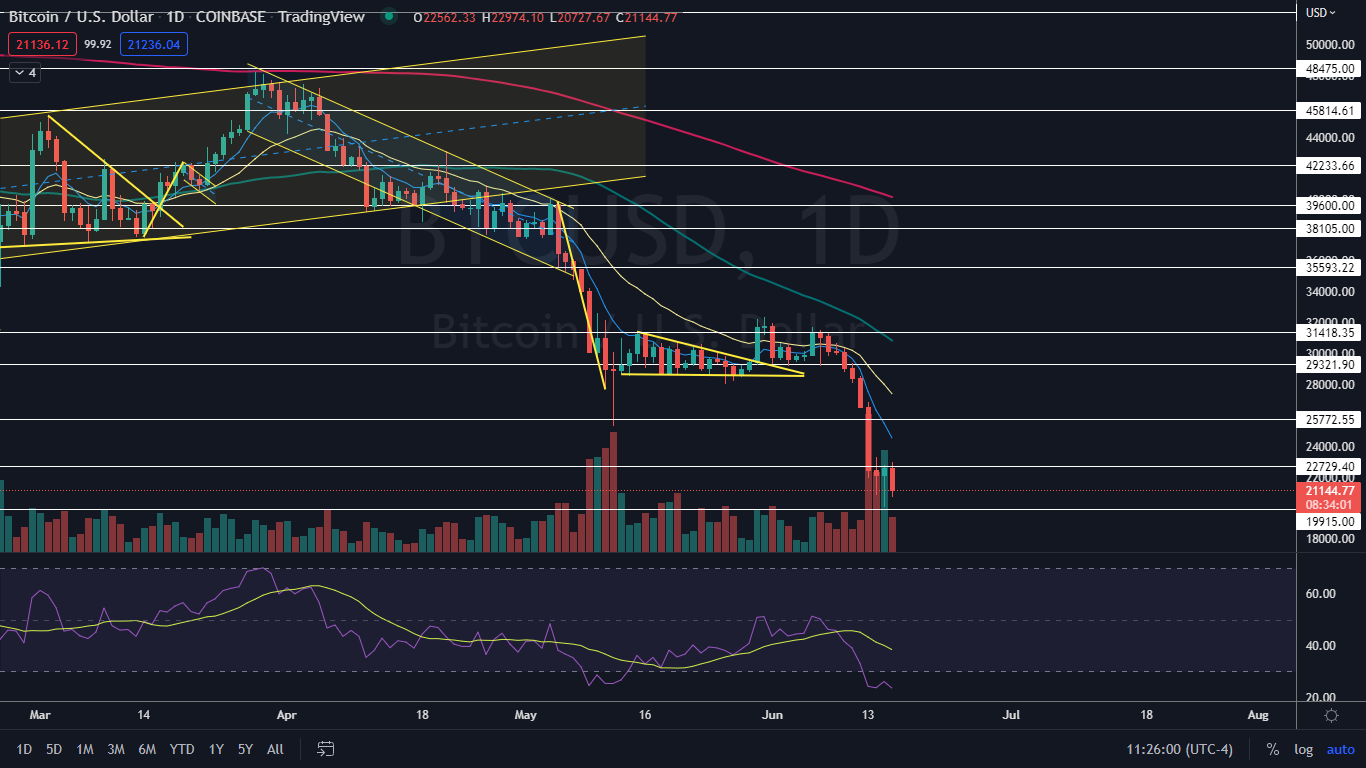
The apex cryptocurrency may be settling into a bear flag pattern on the daily chart.
The bear flag pattern is created with a steep drop lower forming the pole, which is then followed by a consolidation pattern bringing the stock higher between a channel with parallel lines into a tightening triangle pattern or sideways between horizontal trendlines.
- For bullish traders, the "trend is your friend" (until it's not) and the stock may continue to rise upwards within the following channel for a short period of time. Aggressive traders may decide to purchase the stock at the lower trendline and exit the trade at the higher trendline.
- Bearish traders will want to watch for a break down from the lower descending trendline of the flag formation, on high volume, for an entry. When a stock breaks down from a bear flag pattern, the measured move lower is equal to the length of the pole and should be added to the highest price within the flag.
A bear flag is negated when a stock closes a trading day above the upper trendline of the flag pattern or if the flag rises more than 50% up the length of the pole.
Want direct analysis? Find me in the BZ Pro lounge! Click here for a free trial.
The Bitcoin Chart: Bitcoin’s bear flag pattern began to form on June 8, with the pole created between that date and Tuesday and the flag forming over the 24-hour trading sessions that have followed. The measured move, if the pattern is recognized is about 33%, which suggests Bitcoin could plummet toward the $15,500 level.
- The crypto is also trading in a confirmed downtrend, with the most recent lower high created on Tuesday at $23,299 and the most recent confirmed lower low formed at the $20,071 mark on Wednesday. If the crypto breaks down under Wednesday’s low of day over the coming trading sessions, the next lower low will form and traders can then watch for a rebound to the upside where the crypto is likely to print another lower high.
- Eventually, a larger bounce to the upside is likely to come because Bitcoin’s relative strength index (RSI) has been hovering between 23% and 25% for the past three 24-hour trading sessions. When a stock or crypto’s RSI falls under the 30% level it becomes oversold, which can be a buy signal for technical traders.
- Bitcoin has resistance above at $22,729 and $25,772 and support below at psychologically important $20,000 mark and at $19,915.
 See Also:
 © 2024 Benzinga.com. Benzinga does not provide investment advice. All rights reserved.
Comments
Trade confidently with insights and alerts from analyst ratings, free reports and breaking news that affects the stocks you care about.

