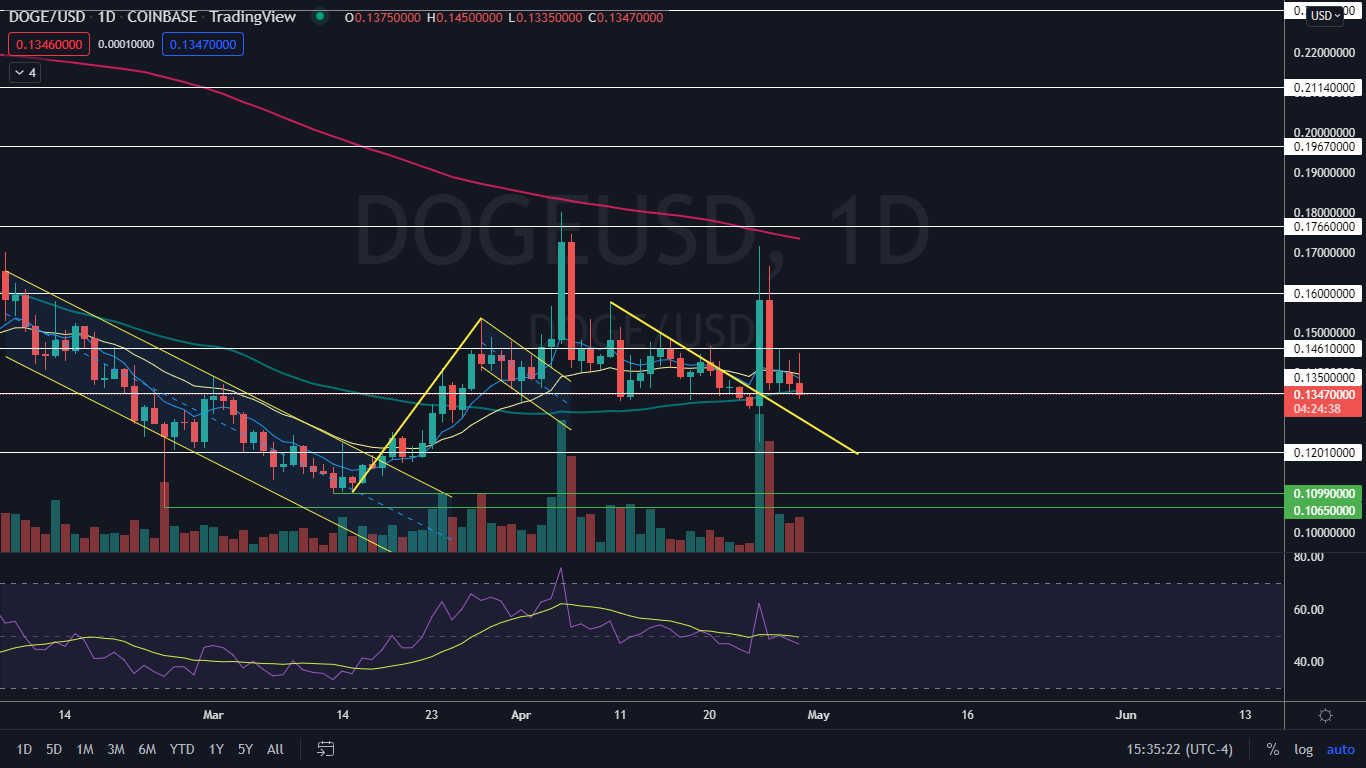
Dogecoin DOGE/USD fell through a support level at $0.135 on Friday, after struggling to hold above the level for the 24-hour trading period.
If the crypto would have held above the key support area, Dogecoin would have printed a quadruple bottom pattern, making it likely to bounce up higher over the weekend. When the crypto fell below the level, however, Dogecoin printed a lower low, which set the crypto into a downtrend.
A downtrend occurs when a stock consistently makes a series of lower lows and lower highs on the chart.
The lower lows indicate the bears are in control while the intermittent lower highs indicate consolidation periods.
Traders can use moving averages to help identify an uptrend with descending lower timeframe moving averages (such as the eight-day or 21-day exponential moving averages) indicating the stock is in a steep shorter-term downtrend and descending longer-term moving averages (such as the 200-day simple moving average) indicating a long-term downtrend.
A stock often signals when the lower low is in by printing a reversal candlestick such as a doji, bullish engulfing or hammer candlestick. Likewise, the lower high could be signaled when a doji, gravestone or dragonfly candlestick is printed. Moreover, the lower lows and lower highs often take place at resistance and support levels.
In a downtrend the "trend is your friend" until it’s not and in a downtrend, there are ways for both bullish and bearish traders to participate in the stock:
- Bearish traders who are already holding a position in a stock can feel confident the downtrend will continue unless the stock makes a higher high. Traders looking to take a position in a stock trading in a downtrend can usually find the safest entry on the lower high.
- Bullish traders can enter the trade on the lower low and exit on the lower high. These traders can also enter when the downtrend breaks and the stock makes a higher high indicating a reversal into an uptrend may be in the cards.
Want direct analysis? Find me in the BZ Pro lounge! Click here for a free trial.
The Dogecoin Chart: On Friday, Dogecoin printed both a lower high at the $0.145 level and a lower low at $$0.133, setting the crypto into a confirmed downtrend.
The crypto may fall down to retest the descending trendline that Dogecoin broke up bullishly from on April 25, and if Dogecoin prints a reversal candlestick at or above the level, such as a doji or hammer candlestick, it may provide a solid entry point for bullish traders who are not already in a position.
- The drop through the support zone at $0.135 came on higher-than-average volume on lower timeframes, which indicates the bears are currently in control. The long upper wicks on the last four 24-hour candles also indicates that there is a high volume of sellers at and above the 14-cent mark.
- If Dogecoin closes the trading session below the $0.134 mark, it will lose support at the 50-day simple moving average (SMA), which is bearish. The crypto is also being pressured lower by the eight-day and 21-day exponential moving averages (EMAs), which may continue to guide Dogecoin into a deeper downtrend.
- Dogecoin has resistance above at $0.135 and $0.146 and support below near 12 cents and the 10-cent mark.
See Also: EXCLUSIVE: Billy Markus On Creating Dogecoin, The Negatives Of Cryptocurrency, NFTs And Elon Musk
© 2024 Benzinga.com. Benzinga does not provide investment advice. All rights reserved.
Comments
Trade confidently with insights and alerts from analyst ratings, free reports and breaking news that affects the stocks you care about.

