
Bitcoin BTC/USD and Ethereum ETH/USD were trading up about 2.4% and 2.2%, respectively, on Thursday, in tandem with the S&P 500, which was trading about 1% higher.
On March 22, Bitcoin broke up from a bull flag pattern that Benzinga Pro called out the day prior, and on March 23, Ethereum broke up from the same pattern that Benzinga Pro also called out on March 21. The break up from the bull flag patterns has caused the cryptos to continue in their strong uptrends.
An uptrend occurs when a stock or crypto consistently makes a series of higher highs and higher lows on the chart.
The higher highs indicate the bulls are in control while the intermittent higher lows indicate consolidation periods. Traders can use moving averages to help identify an uptrend with rising lower timeframe moving averages (such as the eight-day or 21-day exponential moving averages) indicating the stock or crypto is in a steep shorter-term uptrend and rising longer-term moving averages (such as the 200-day simple moving average) indicating a long-term uptrend.
A stock or crypto often signals when the higher high is in by printing a reversal candlestick such as a doji, bearish engulfing or hanging man candlestick. Likewise, the higher low could be signaled when a doji, morning star or hammer candlestick is printed. Moreover, the higher highs and higher lows often take place at resistance and support levels.
In an uptrend, the "Trend is your friend" until it’s not and in an uptrend, there are ways for both bullish and bearish traders to participate in the stock.
- Bullish traders who are already holding a position in a stock or crypto can feel confident the uptrend will continue unless the security makes a lower low. Traders looking to take a position in a stock or crypto trading in an uptrend can usually find the safest entry on the higher low.
- Bearish traders can enter the trade on the higher high and exit on the pullback. These traders can also enter when the uptrend breaks and the stock or crypto makes a lower low indicating a reversal into a downtrend may be in the cards.
See Also: Why Bitcoin- And Ethereum-Related Stocks Are Rising
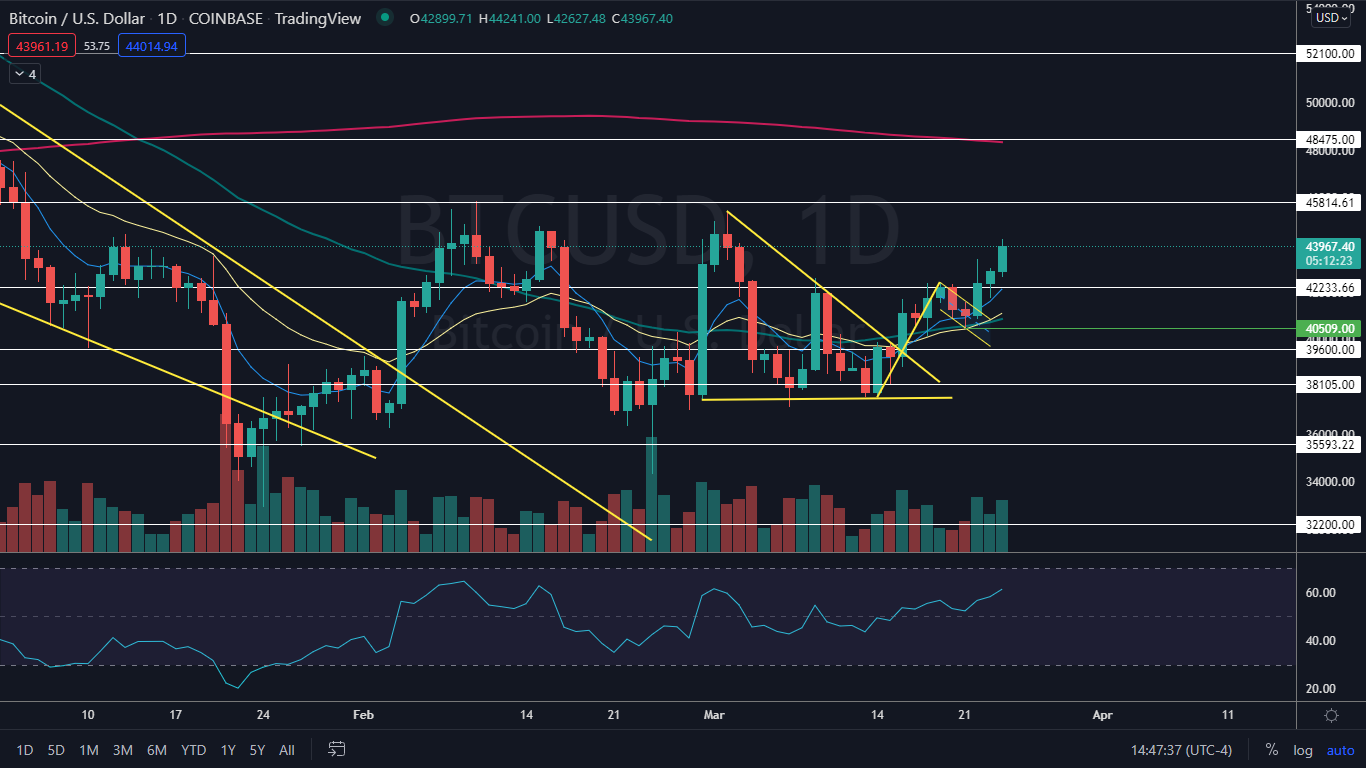
The Bitcoin Chart: Bitcoin reversed course into an uptrend on March 14 and has made a consistent series of higher highs and higher lows, with the most recent higher low created on March 21 at the $40,509 level and the most recent higher high formed on Thursday.
- Bitcoin hasn’t yet completed the measured move of the break of the bull flag pattern, which suggests Bitcoin should trade up toward $45,000.
- On Thursday, Bitcoin looked to be printing a bullish Marubozu candlestick, which indicates the crypto is likely to trade higher again on Friday. Bullish traders who are not already in a position may choose to wait for the next higher low to print before entering into a trade.
- Bitcoin is trading above the eight-day and 21-day exponential moving averages (EMAs), with the eight-day EMA trending above the 21-day, both of which are bullish indicators.
- On Thursday, Bitcoin was trading up on higher-than-average volume, which indicates there is currently a high level of investor interest in the crypto. By midafternoon, Bitcoin’s volume was measuring in at over 18,600 compared to the 10-day average of 14,969.
- Bitcoin has resistance above at $45,814 and $48,475 and support below at $42,233 and $39,600.
Want direct analysis? Find me in the BZ Pro lounge! Click here for a free trial.
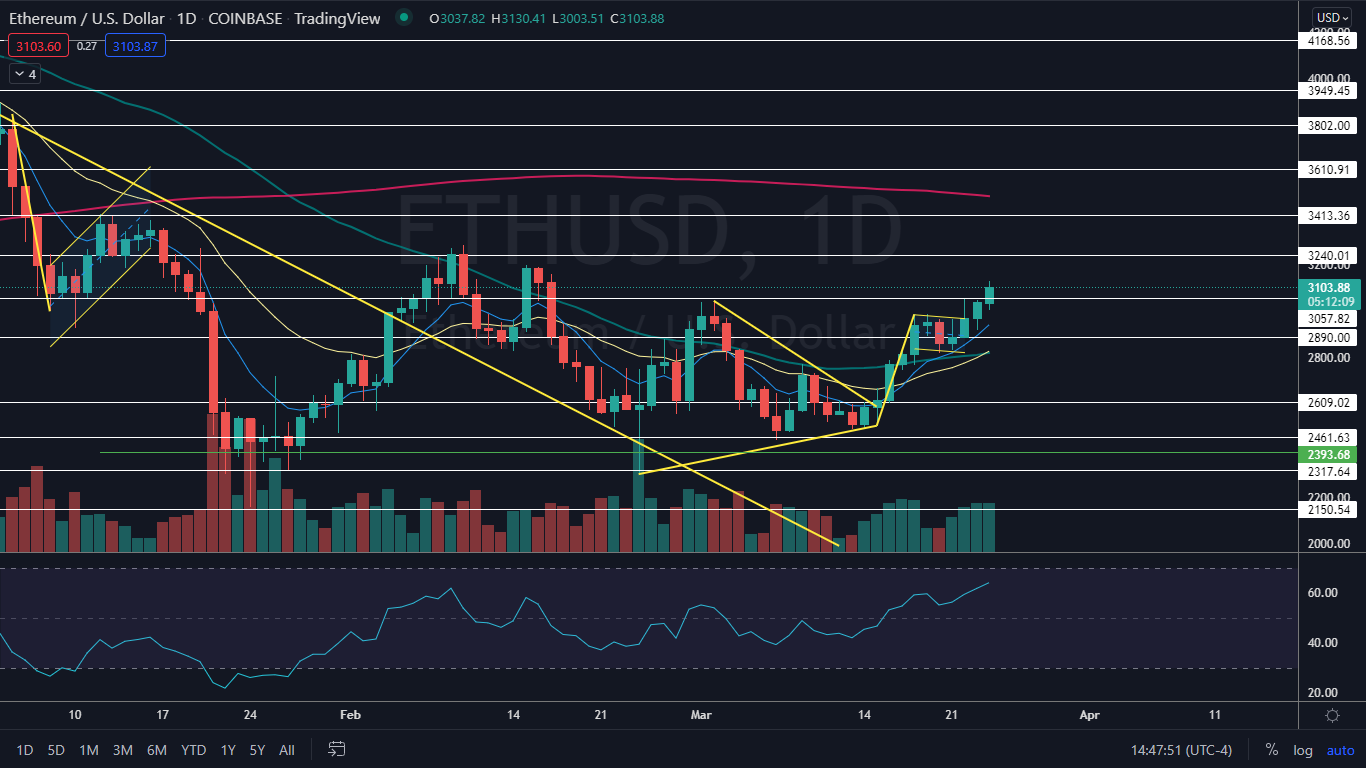
The Ethereum Chart: Like Bitcoin, Ethereum reversed course into an uptrend on March 14 and has made a consistent series of higher highs and higher lows. The crypto’s most recent higher low was printed on March 20 at $2,832 and the most recent higher high was made on Thursday.
- Also like Bitcoin, Ethereum still has room to complete the measured move of the break of the bull flag pattern, which indicates the crypto could reach $3,400 in the future.
- Ethereum’s volume on Thursday was measuring in at over 213,000 compared to the 10-day average of 179,237.
- Bullish traders who are not already in a position may choose to wait for the next pullback, which should take place above the $2,832 mark.
- Ethereum has resistance above at $3,240 and $3,413 and support below at $3,057 and $2.890.
© 2024 Benzinga.com. Benzinga does not provide investment advice. All rights reserved.
Comments
Trade confidently with insights and alerts from analyst ratings, free reports and breaking news that affects the stocks you care about.

