Ethereum Classic ETC/USD, Ethereum ETH/USD and Bitcoin BTC/USD were just a few of the popular cryptocurrencies consolidating on Tuesday. All three cryptos had a relative strength index (RSI) registering above 70% which put them into overbought territory and the consolidation was needed.
For technical traders, an extended RSI is a sell signal and some traders of the cryptos may have decided to sell some or all of their positions with the hope to buy back and lower or average down on their trade. The average daily volume for Ethereum Classic, Ethereum and Bitcoin was low as of late afternoon, indicating traders were not exiting their positions en masse which is a good sign for the bulls.
On Tuesday, Ethereum Classic’s RSI dropped down to the 65% level and was settling into two bullish patterns while holding above support at $65.10
See Also: Ethereum Already 'Flipped' Bitcoin In This Part Of The World
The Ethereum Classic Chart: On Aug. 7, Ethereum Classic broke up bullishly from a symmetrical triangle the crypto had been trading in since around June 1. Ethereum Classic then traded sideways for five days to consolidate the move higher. Ethereum shot up almost 30% and has spent the past two days consolidating the move.
The most recent rise followed by consolidation has helped Ethereum Classic to form a bull flag pattern on the daily chart with the pole created between Aug. 13 and 15 and the flag on Monday and Tuesday. If Ethereum Classic breaks up bullishly from the flag pattern it has the potential to soar another 30% higher from the lowest point in the flag pattern, which could cause the crypto to reach $86.50.
Ethereum is also trading in a bullish rounded bottom pattern indicating higher prices may come in the future. The rounded bottom pattern began with a decline in price beginning on May 28 and was eventually followed by a curl back north on July 20.
See Also: Bitcoin vs Ethereum • What's the Difference?
Ethereum Classic is trading above the eight-day and 21-day exponential moving averages with the eight-day EMA trending above the 21-day, both which are bullish indicators. The crypto is also trading over 65% above the 200-day simple moving average indicating overall sentiment is bullish.
- Bulls want to see continued consolidation within the flag before big bullish volume comes in and breaks Ethereum Classic up bullishly from the pattern. If it breaks up from the flag it has resistance above the $72 and $79 levels.
- Bears want to see big bearish volume come in and push Ethereum Classic down below the eight-day EMA which would invalidate the bull flag. If the crypto loses support at $65.10 it could revisit lower support near $57.

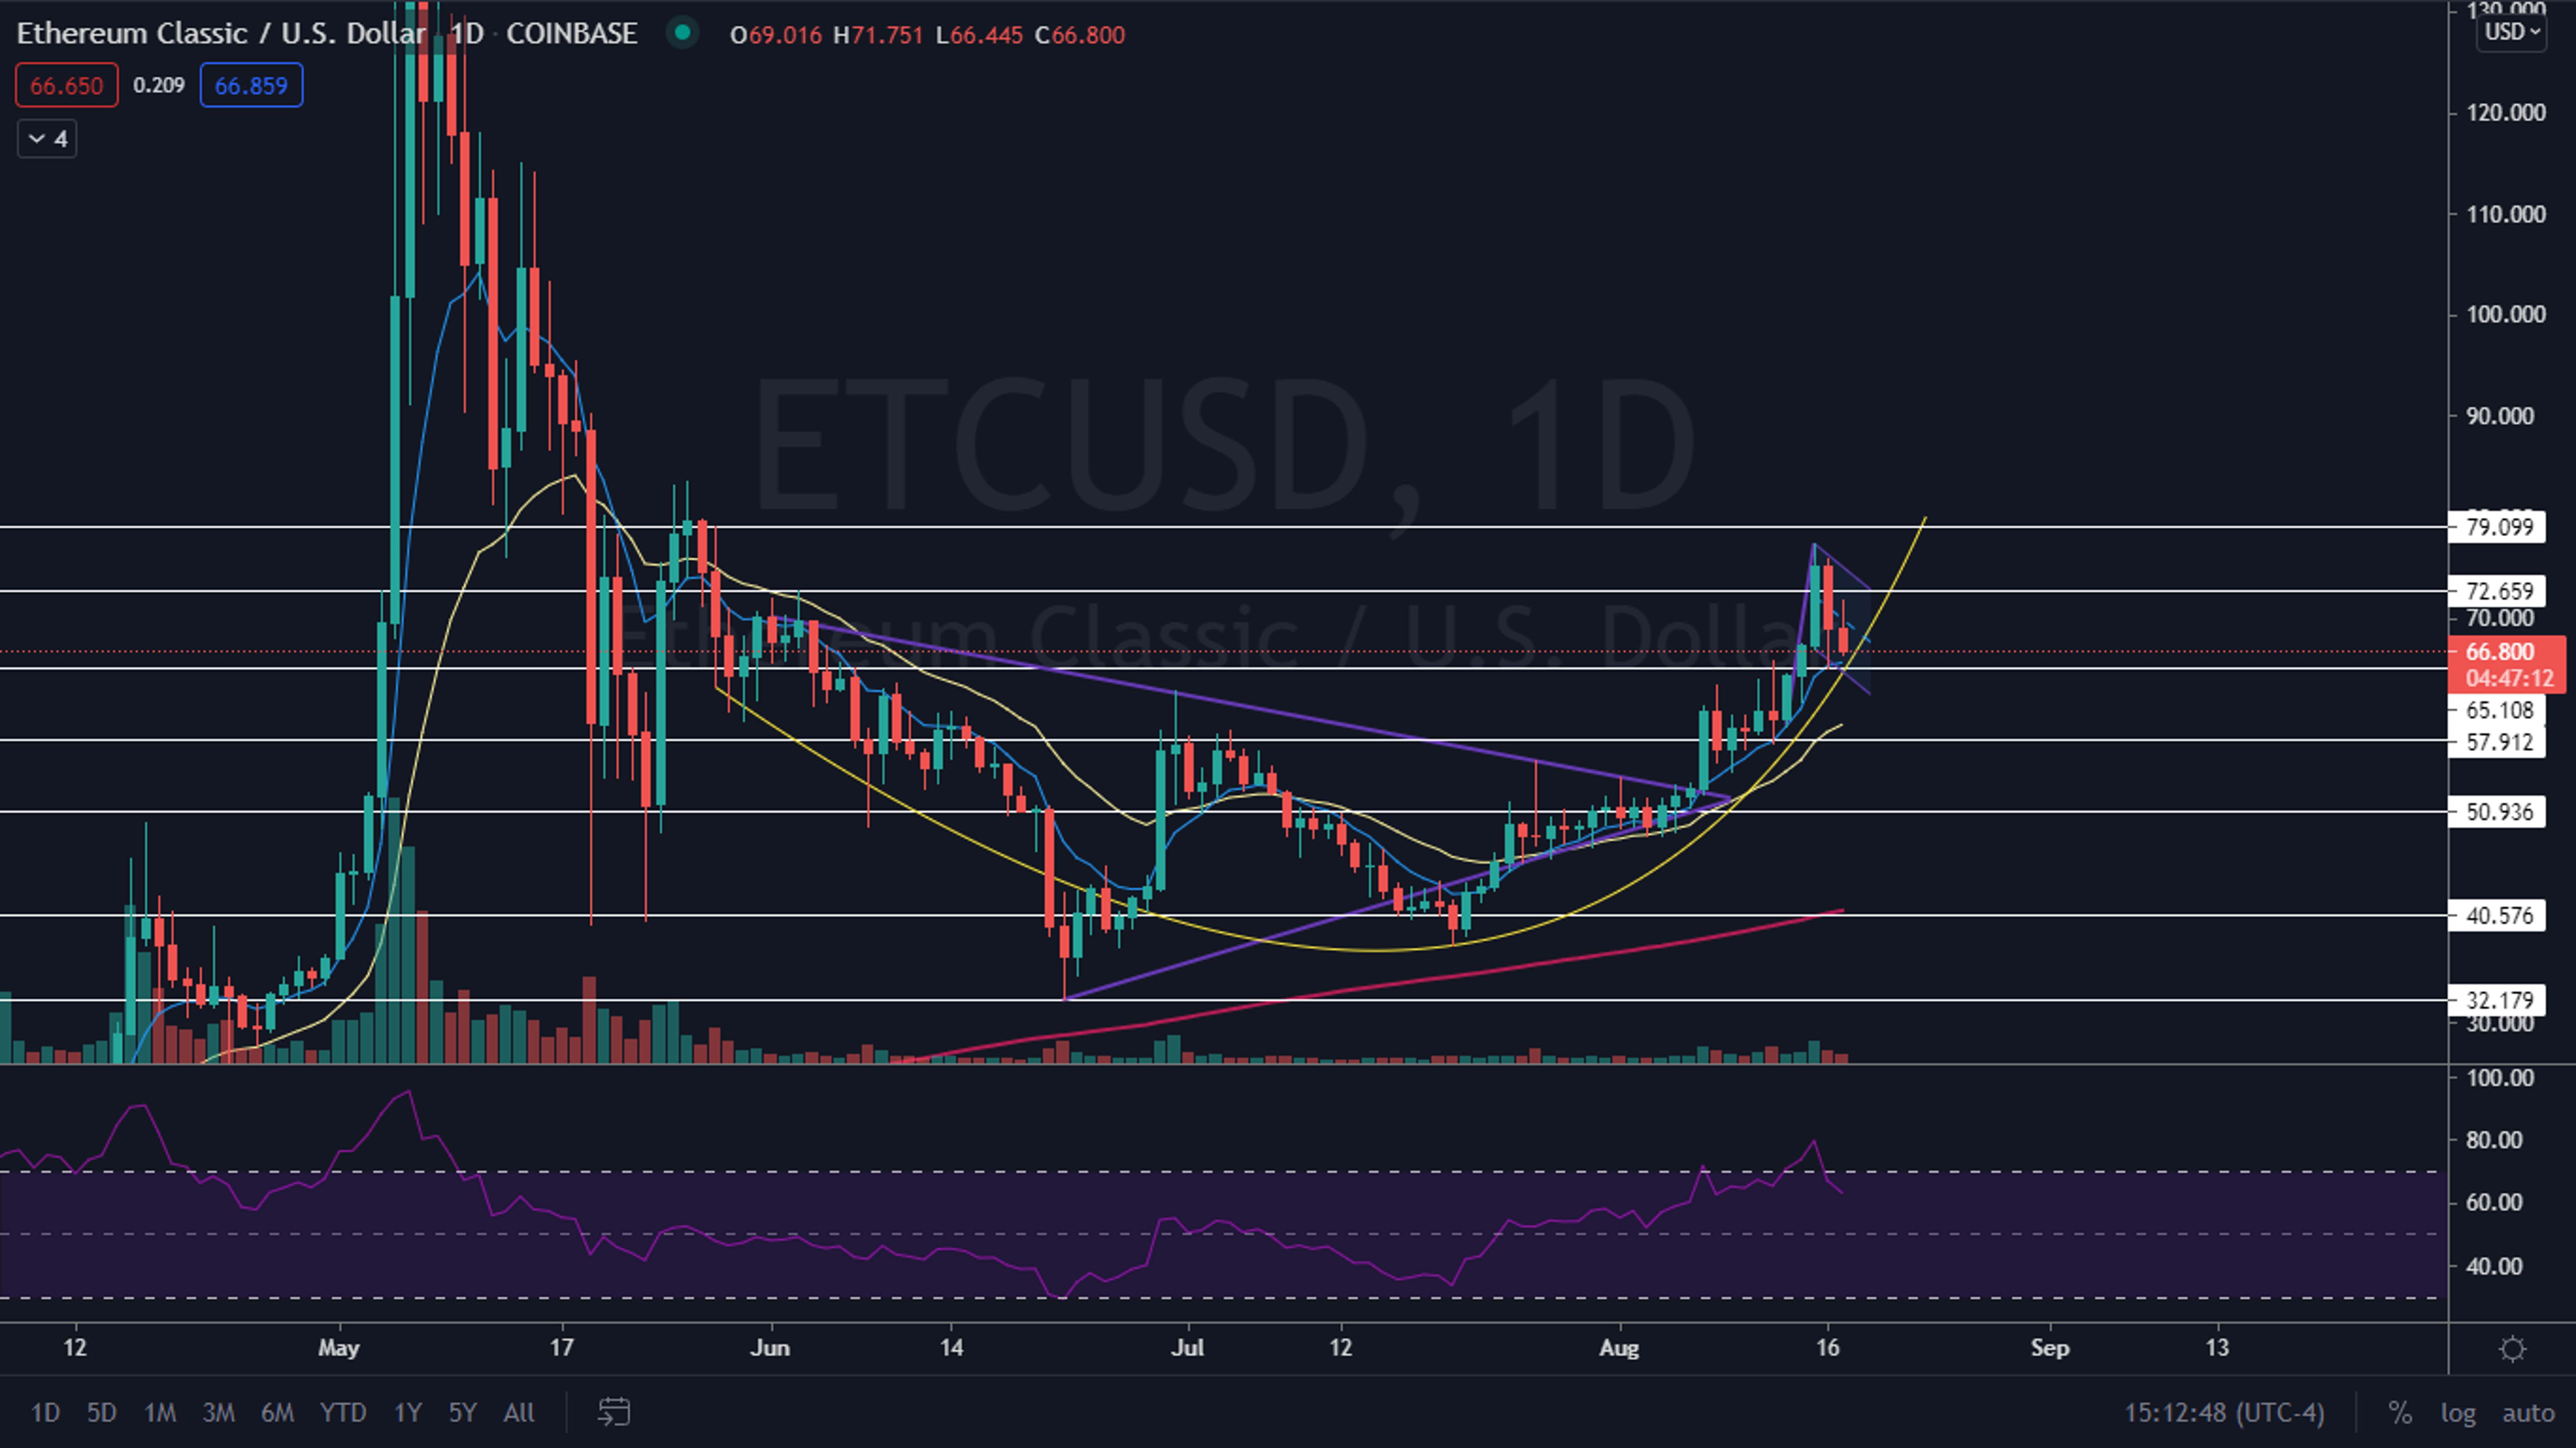
Image: Ethereum Classic
© 2024 Benzinga.com. Benzinga does not provide investment advice. All rights reserved.
Trade confidently with insights and alerts from analyst ratings, free reports and breaking news that affects the stocks you care about.

