Alibaba Group Holdings, Ltd BABA gapped 3.64% higher on Thursday in tandem with the Hang Seng Index, which closed up 3.38% in Hong Kong.
After the market opened, the China-based e-commerce and tech giant spiked an additional 2.5%, led by the S&P 500, which was bouncing slightly. The tick higher caused Alibaba to climb above the 200-day simple moving average (SMA).
Xi Jinping’s government started to ease its strict COVID-19 restrictions on Wednesday after rare protests in the country started to gain steam late last month. The relaxation of China’s zero COVID policy could help its economy and boost China’s stocks, especially tech-based companies.
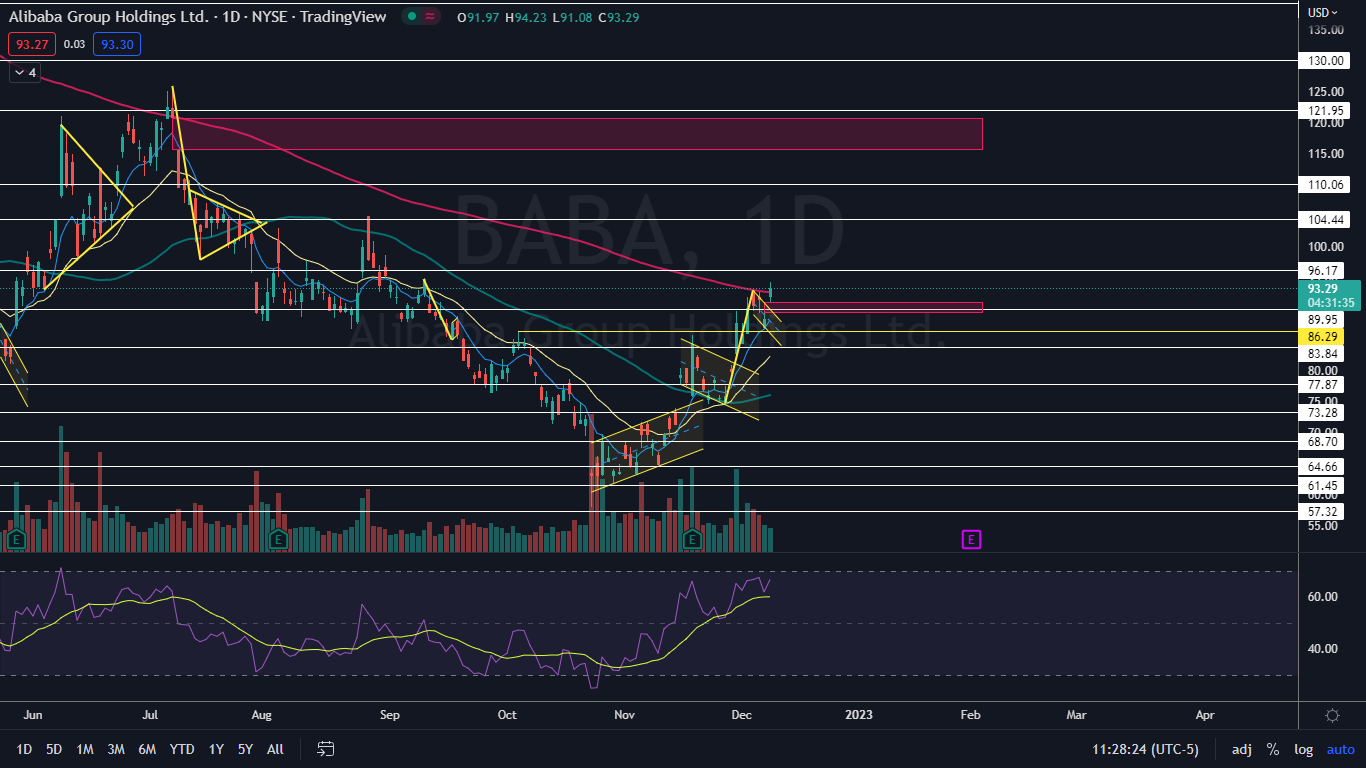
Alibaba has been trading near the 200-day SMA for the last six trading days, attempting to break through the level on Monday and Tuesday but failing. On Thursday, Alibaba was battling with the level, popping up above the 200-day periodically before falling back under the level.
The 200-day SMA is a bellwether indicator that indicates whether a stock or index is in a bull or bear cycle. The area acts as both heavy support and heavy resistance, and it’s very difficult for a security to break through the 200-day on the first, or even second, attempt.
Want direct analysis? Find me in the BZ Pro lounge! Click here for a free trial.
The Alibaba Chart: Bullish traders will want to see Alibaba close above the 200-day and then for bullish momentum to come in and push the stock higher on Friday. Bearish traders want to see Alibaba close under the indicator and then for big bearish volume to come in and drop Alibaba down under the eight-day exponential moving average.
- Alibaba was struggling with the 200-day SMA on Thursday because the Hang Seng hasn’t regained the same indicator and because the S&P 500 fell under the 200-day on Monday after forming a bull trap over the area last week.
- If Alibaba closes above the level and falls back over the next few days to test the 200-day as support, bullish traders will want to see a reversal candlestick print on smaller time frames.
- The spike higher on Thursday could be a bullish break from a bull flag pattern, which was created between Nov. 28 and Wednesday. If the pattern was recognized and Alibaba continues to trend higher, the measured move is about 24%, which indicates Alibaba could eventually surge up toward $107.
- If Alibaba closes the trading day near to flat, the stock will print a doji candlestick, which could indicate lower prices will come on Friday. If the stock closes near its high-of-day price, Alibaba will print a bullish kicker candlestick, which could indicate higher prices are in the cards.
- Alibaba has resistance above at $96.17 and $104.44 and support below at $89.95 and $86.29.
 Read Next: Jack Ma Gives Up Position In China's Prestigious Guild - Read Why
Photo via Shutterstock.
© 2024 Benzinga.com. Benzinga does not provide investment advice. All rights reserved.
Comments
Trade confidently with insights and alerts from analyst ratings, free reports and breaking news that affects the stocks you care about.

