


(Monday market open) Last week investors may have felt like the market had fallen and couldn’t get up, to quote an old ad—and the market looks poised to continue limping through this final week of September.
Futures based on the S&P 500® Index (SPX) fell to a three-and-a-half-month low overnight and were down slightly shortly before the U.S. market open. Futures based on the Nasdaq 100 (NDX) and Dow Jones Industrial Average (DJI) were also modestly lower. That suggests the market’s four-day losing streak could extend to five. Last Friday, an early rally attempt belly-flopped, leaving the SPXdown roughly 3% for the week—its worst weekly performance since March.
A “trifecta of trouble” that bedeviled investors much of this month—rising Treasury yields, rising oil prices, and ongoing strength in the U.S. dollar—likely will continue to burden equities at the start of this week, says Kevin Gordon, senior investment strategist at Schwab. Treasury yields climbed overnight, with the 10-year note near a 16-year high around 4.51%.
A hawkish tone struck by the Federal Reserve following its policy meeting last week appeared to deflate investor spirits, as the central bank suggested another interest rate hike may be coming. A potential U.S. government shutdown October 1 further complicates the picture. Volatility readings that have jumped to one-month highs convey stepped-up market skittishness.
Morning rush
- The 10-year Treasury note yield (TNX) was up nearly 7 basis points at 4.51%.
- The U.S. Dollar Index ($DXY) was up slightly at 105.67.
- Cboe Volatility Index® (VIX) futures were up about 0.43 at 17.93.
- WTI Crude Oil (/CL) was little changed around $90 a barrel.
Just in
European stocks started lower today. Asian markets, with the exception of Japan, were also under pressure. China’s Hang Seng Index HK fell nearly 2%. The Japanese yen extended a two-month slide against the U.S. dollar, reaching nearly 149—its weakest level in 11 months.
What to watch
Week ahead: Today’s schedule is quiet as Q3’s final week begins. Things pick up from here, with investors getting a look on Tuesday at September Consumer Confidence and August New Home Sales. August Durable Goods follow on Wednesday, and Thursday brings the final estimate for Q2 Gross Domestic Product (GDP) after a downward revision last month to 2.1% from 2.4%. The week will close on Friday with Personal Consumption Expenditure (PCE) prices, the inflation metric watched most closely by the Fed.
The last week of a quarter sometimes features more volatility as fund managers engage in “window dressing,” dumping losers and adding winners before mailing quarterly results to their clients.
Shutdown—what to know: Washington will occupy center stage as investors assess the chances of an October 1 government shutdown. Wall Street could be sensitive to headlines in coming days. Previous shutdowns have caused volatility on Wall Street and had an impact on the economy. To learn more about the possible ramifications, read the latest insights from Michael Townsend, Schwab’s managing director of legislative and regulatory affairs
Stocks on the move
Earnings are light this week, but the companies that do report are influential, such as semiconductor giant Micron (MU) on Wednesday afternoon and athletic firm Nike NKE on Thursday afternoon.
The past week was particularly rough on smaller companies and other parts of the market considered exposed to recession risks. The small-cap Russell 2000 Index (RUT) sank 3.4%, ending Friday at its lowest point since June 1. The Dow Jones Transportation Index ($DJT) also reflected recession concerns, dropping more than 2% for the week. The energy sector was down for the week despite crude oil futures holding near 10-month highs of more than $90 a barrel.
Eye on the Fed
As of this morning, the probability that the Federal Open Market Committee (FOMC) will raise rates following its October 31-November 1 meeting is slightly over 25%, according to the CME FedWatch Tool. There’s around a 36% probability priced in that rates could be a quarter-point higher coming out of the December meeting.
On Friday, you had to get in line to be a Fed speaker talking about more rate increases. Through lunchtime alone, four of them had taken the mic and echoed Fed Chairman Jerome Powell’s sentiment from his press conference two days earlier. Stocks seemed sensitive to the comments, retreating by midday from early gains, though Treasury yields fell by the close.
Talking technicals: The SPX dipped below key intermediate-term technical support last week near the August low of around 4,335. The close below that on Thursday was “significant” from a chart perspective, says Nathan Peterson, director of derivatives analysis at the Schwab Center for Financial Research. The 4,335 level roughly coincides with the mid-June low and represents the neckline of a potential head-and-shoulders top which formed over the summer. Despite that, it’s likely too early to say the market’s departed from the summer up-trend that put it into bull territory. Sometimes it takes several days of closes below key technical levels to confirm a new trend.
The question is whether investors continue to buy at these levels, as they appeared to early Friday. Today’s high Treasury yields (well above 5% for the 2-year Treasury note) mean the stock market has far more competition for investor money now than it did back in early June when the rally accelerated.
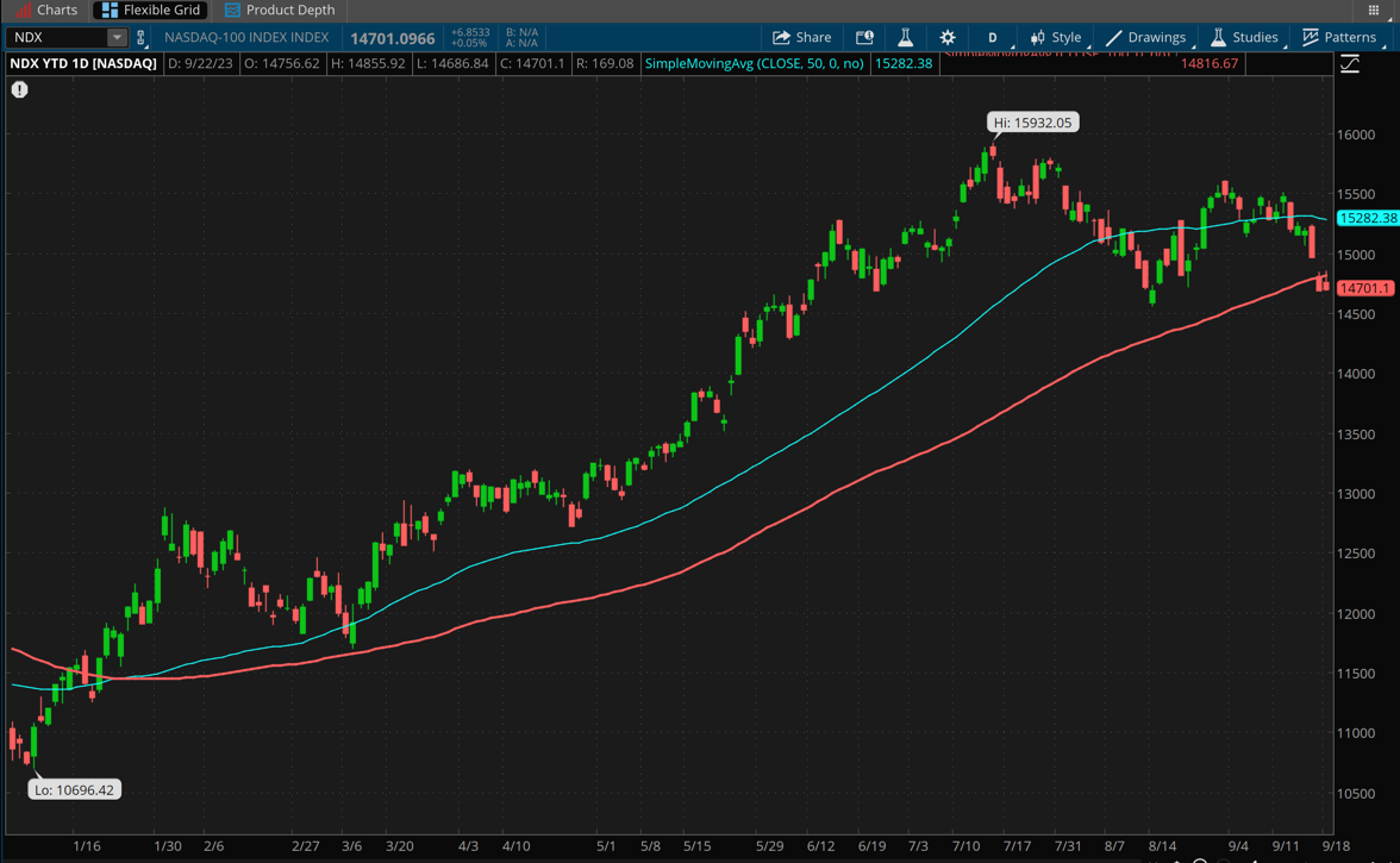
CHART OF THE DAY: MIRROR IMAGE. If this year-to-date chart of the Nasdaq-100 (NDX—candlesticks) looks like charts of the S&P 500 (SPX), you’ve seen lately, you’re not mistaken. Like the SPX, the NDX just had its worst week since March and slipped well below both its 50-day and 100-day moving averages (blue and red lines). Data source: Nasdaq. Chart source: thinkorswim® platform. For illustrative purposes only. Past performance does not guarantee future results.
Thinking cap
Ideas to mull as you trade or invest
More bad breadth: A word heard a lot on Wall Street lately is “breadth,” and lately it’s gone the wrong way for stocks. Meaning most of the S&P 500’s members trade below their respective 50-day moving averages. The percentage reached 80% by late last week, compared with around 60% above their 50-day averages when the market peaked in July. Sometimes such a big percentage of stocks trading below average might be a counterintuitive bullish signal, but in this case that may not be true. “It would have been much more constructive to see the air come out of the mega-caps and go into the rest of the market, but that hasn’t happened,” says Kevin Gordon, senior investment strategist at Schwab. “In fact, the opposite is almost the case, since the equal-weighted S&P is down more than the cap-weighted since July 31.” Meaning the cracks in mega-cap’s armor over the last few weeks weren’t accompanied by strength elsewhere, something bullish investors had hoped to see in June and July when mega-caps pulled the SPX higher without much participation from smaller stocks in the index.
Rough ride for Retail: A handful of big-store stocks took a beating Friday as investors started dialing in recession fears. Dollar Tree DLTR hit lows last seen in late 2021, while Dollar General DG traded at a price last posted in January 2019, Briefing.com noted. Target TGT hit lows not seen since June 2020. The pressure on retailers didn’t appear related to any obvious news other than the autoworkers’ strike, though fresh analyst notes on two of the companies may have rattled investors. The broader concern with consumer-oriented stocks likely goes back to higher borrowing costs that could hurt economic growth (and potentially consumer spending) in Q4. The New York Fed Staff Nowcast on Friday fell for both Q3 and Q4 real Gross Domestic Product (GDP) based on soft Philadelphia Fed Manufacturing survey data.
Is China turning corner? Chinese stocks are outperforming the SPX in Q3 despite all the worries about slow growth across the Pacific. Some green shoots emerged recently, notes Jeffrey Kleintop, chief global investment strategist at Schwab. These include news that Beijing is considering easing restrictions on foreign ownership of domestically listed companies, as well as signs of a thaw in relations between the U.S. and China. Recent high-level meetings between officials were followed by the announcement of working groups to discuss economic and financial issues. “The combination of cooling tensions, market reforms, and incremental stimulus leading to better-than expected economic data for August reported this month has helped Emerging Markets (EM) stocks pull slightly ahead of the S&P 500 for the third quarter,” Kleintop says.
Calendar
Sept. 26: September Consumer Confidence, August New Home Sales, and expected earnings from Costco (COST).
Sept. 27: August Durable Goods Orders and expected earnings from Micron (MU).
Sept. 28: Third estimate of Q2 Gross Domestic Product (GDP), August Pending Home Sales, and expected earnings from CarMax (KMX) and Nike (NKE).
Sept. 29: September Chicago PMI, August Personal Income and Personal Spending, August Personal Consumption Expenditures (PCE) prices.
Oct. 2: September ISM Manufacturing Index and August Construction Spending.
TD Ameritrade® commentary for educational purposes only. Member SIPC.
Image sourced from Shutterstock
This post contains sponsored content. This content is for informational purposes only and not intended to be investing advice.
Edge Rankings
Price Trend
© 2025 Benzinga.com. Benzinga does not provide investment advice. All rights reserved.
Trade confidently with insights and alerts from analyst ratings, free reports and breaking news that affects the stocks you care about.

