


(Tuesday market open) Narrow, choppy trading typical of the days approaching a Federal Reserve interest rate decision seems likely to continue Tuesday. The Fed meeting begins today and concludes tomorrow, with markets baking in a likely pause in rate hikes, yet investors remain on edge about policymakers’ economic and interest rate projections.
Some of the elements that squelched recent rally attempts continued to pose a threat early Tuesday, including crude oil prices and U.S. Treasury note yields. However, the dollar gave back some ground and the 10-year Treasury note yield is a few ticks below the recent 16-year highs it approached intraday yesterday.
Anyone hoping for big market moves probably came away disappointed the last few days. The S&P 500® Index (SPX) traded within a very narrow range of just 24 points yesterday, the second day in the last four where the range was less than 30 points—well under a 1% change. With so many central bank meetings this week, trading could remain featureless in coming days barring a major catalyst from outside the monetary policy world.
Energy shares once again performed well on Monday, while regional banks and consumer discretionary stocks were among the weakest sectors. Info tech, a laggard late last week, bounced back Monday partly on strength in Apple AAPL, which benefited from an upbeat analyst report on iPhone demand. Automaker stocks fell as the United Auto Workers (UAW) strike continued. There were no reports of progress on that front this morning.
Morning rush
- The 10-year Treasury note yield (TNX) edged higher to 4.32%.
- The U.S. Dollar Index ($DXY) is slightly lower at 104.85.
- Cboe Volatility Index® (VIX) futures are steady at 14.02.
- WTI Crude Oil (/CL) climbed 1% to $92.43.
Just in
August Housing Starts and Building Permits—this week’s most closely watched data point—was a mixed bag. Starts came up short of analysts’ average expectations at a seasonally adjusted annual rate of 1.283 million, but permits exceeded estimates at 1.543 million and were the highest since last October, driven almost completely by multi-family housing.
Analysts had expected August permits at a seasonally adjusted annual rate of 1.445 million, according to Trading Economics. Starts were seen at 1.44 million.
This is a very volatile data series, but the permits number generally is more closely watched because it’s used in The Conference Board’s Leading Economic Index. Permits signal future new home demand, so the rise above July’s revised 1.443 million could be seen as a positive signal for the home building industry as well as the major home-improvement retailers like Home Depot HD and Lowe’s LOW.
What to watch
Union Jack: The Bank of England’s (BoE) next rate decision is scheduled for Thursday. A “dovish hike” might be the outcome, says Schwab’s director of international research Michelle Gibley, who notes that “wage growth and services inflation have been hot, but weakness in the economy and rising unemployment are weighing on the outlook.” The BoE raised rates a quarter-point in August to 5.25%. The Bank of Japan (BoJ) announces a rate decision on Friday.
Keep an eye on crude oil prices today as front-month CME futures appear to be approaching an area of resistance on the charts near $93 per barrel. Crude’s been riding a solid uptrend since midsummer and already plowed through previous resistance levels, but just above $93 represents the peak from last autumn.
Stocks in Spotlight
Earnings patrol: Shares of shipping firm FedEx FDX flew high to start 2023 but leveled off this summer. They now trade down nearly 7% from their late-July peak, partly because of concerns about potential competition from Amazon AMZN. That company already ships plenty of its own goods but has been branching into delivery of third-party products. One thing to glean from FedEx earnings after the close Wednesday is whether this budding competition has started to nip at their heels.
Other major company reports to watch include KB Home KBH and General Mills GIS, both scheduled for tomorrow. Homebuilder sentiment took a hit this month, according to the National Association of Home Builders/Wells Fargo Housing Market Index released yesterday, but homebuilder stocks have generally performed well, in part due to a shortage of housing.
Competing builder Lennar LEN reported upbeat earnings last week. KB Home could have an interesting perspective on the state of the industry due to the high percentage of homes it sells to first-time buyers (48% of homes it delivered in Q2). It reports tomorrow after the close.
You’re going the wrong way: Though weakness on Wall Street lately centered on the tech sector amid demand concerns in the semiconductor space, there’s a broad trend toward slipping performance in equities. Only 30% of all S&P 500 stocks now trade above their respective 50-day moving averages.
Much of this is a function of rising Treasury note yields. The 10-year U.S. Treasury yield bumped up against 4.35% on Monday, near recent 16-year highs. A move above that could put more pressure on rate-sensitive sectors, including tech, notes Joe Mazzola, Schwab’s director of trader education. Dividend-payers like utilities and real estate investment trusts (REITS) also face a negative impact from rising rates.
Eye on the Fed
As of this morning, the probability that the FOMC will maintain current rates after this week’s meeting is 99%, according to the CME FedWatch Tool. The tool pegs the probability of rates being higher after the November meeting at around 29%.
This week’s meeting includes updates to Fed economic projections and its dot-plot of the rate path ahead. Policymakers are likely to revise economic projections upward based on recent strong data.
FOMC members predicted in June that rates would finish the current year between 5.5% and 5.75%. That’s a quarter-point above current levels. Futures trading implies virtually no chance of a hike at this week’s gathering, but some analysts call tomorrow’s decision a “hawkish pause” because they believe the Fed’s projections may leave the door open to one more hike this year.
Talking technicals: The S&P 500® Index (SPX) seems drawn toward its 20-day moving average near 4,450. Recent rallies that took the SPX above its 50-day moving average (now near 4,480) quickly met selling that took it back toward the 20-day moving average. Generally, the index has seemed most comfortable hanging out between the 20-day and 50-day averages, but a break below the 20-day could mean testing the 4,350 level where buyers stepped in during late June and mid-August. The 50-day moving average remains a key resistance point.
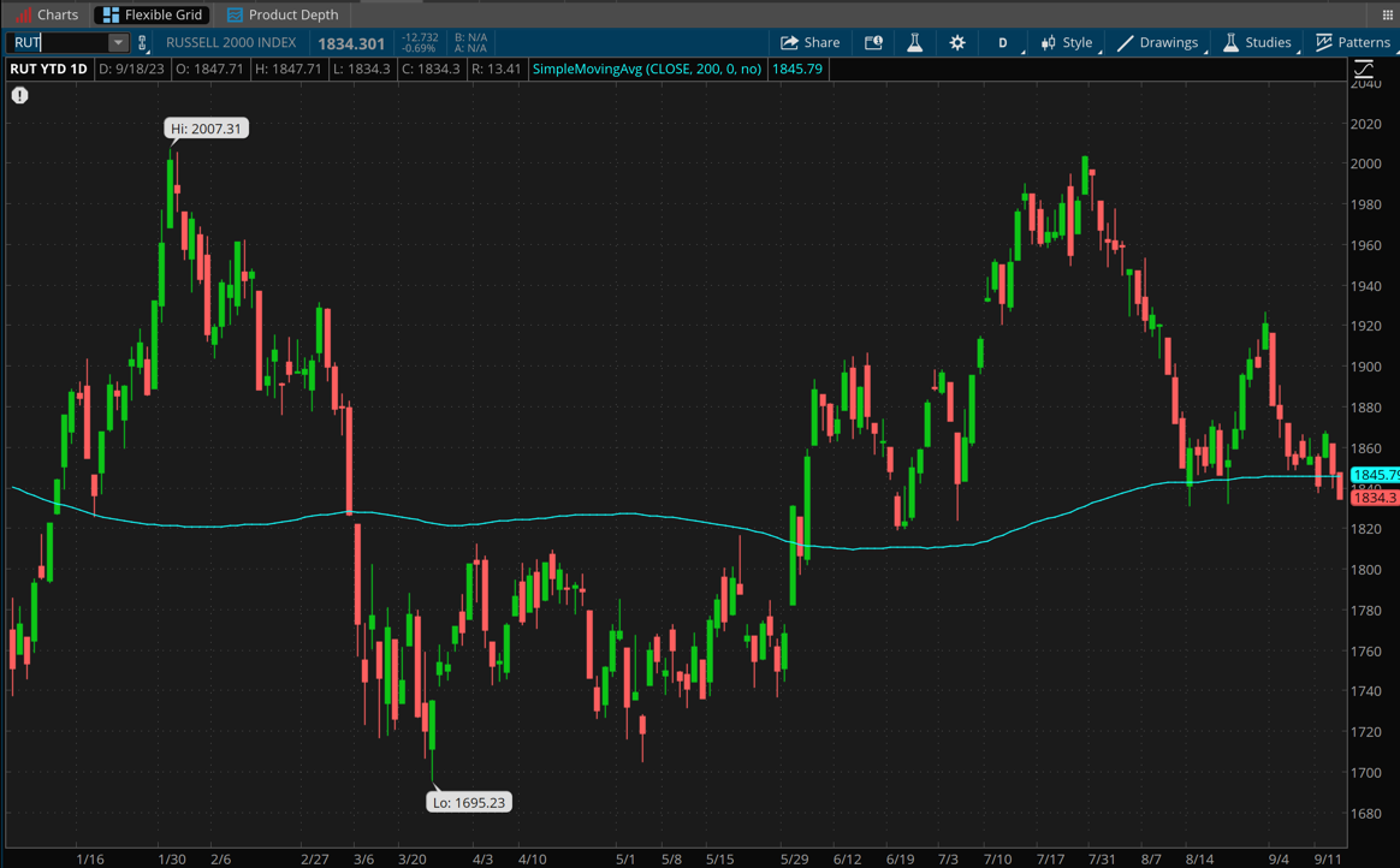
CHART OF THE DAY: LOSING HOLD. The Russell 2000 (RUT—candlesticks) small-cap index is up less than 5% for the year versus a15% rise for the SPX. The recent drop below the 200-day moving average (blue line), which the Russell 2000 spent most of the summer above, could signal worries about rising rates and oil prices, which could hurt smaller companies. Data source: FTSE Russell. Chart source: thinkorswim® platform. For illustrative purposes only. Past performance does not guarantee future results.
Thinking cap
Ideas to mull as you trade or invest
Rising sun: Though the Fed arguably holds pole position in terms of this week’s central bank news, the Bank of Japan (BoJ) might challenge the checkered flag with its rate decision Friday. The last BoJ meeting sent ripples through world markets, in particular U.S. Treasuries and the Dollar Index. Unlike most central banks, the BoJ has kept rates accommodative, helping lift inflation to multi-year highs after deflation crippled the economy for years. Lately there’ve been signs that Japanese rates might stir from their slumber, especially in late July when the BoJ rattled world markets by easing its yield-curve control. The BoJ’s move helped the yen rally versus other currencies and caused a sharp upswing in U.S. Treasury note yields. The thinking appeared to be that if Japan’s rates rise, investors there might be more attracted to domestic debt offerings and find less reason to buy U.S. Treasuries (yields rise as prices fall). New signs of BoJ hawkishness at Friday’s meeting might not lift the ceiling much, but it could help keep the U.S. yield floor elevated. The BoJ may be getting closer to starting its hiking cycle but is not expected to do so this week, says Schwab’s Gibley.
Reading the dots: Back home, investors awaiting the conclusion of the FOMC meeting on Wednesday at 2 p.m. ET should consider carefully following the dots—that is, the so-called dot-plot of policymakers’ rate projections for this year and next. The dots in June clustered closely in favor of one more rate hike this year, with 13 dots in that range. Each dot represents one policymaker’s view. Some key questions ahead of the meeting: Will those dots shift or will the consensus still be strongly in favor of one more hike? Kathy Jones, Schwab’s chief fixed income strategist, also asks look at whether the dots will continue to point to 100 basis points in cuts next year, which the futures market still bakes in. “Or will that number decline, with the initial cut pushed further into the future?” she says. We’ll get the answers Wednesday. A more hawkish dot-plot might tighten pressure on Treasuries even as yields weigh on stocks.
The dreaded “I” word: Just 296 S&P 500 companies cited the term “inflation” during their Q2 earnings calls—the lowest since Q2 2021 and down from more than 400 that mentioned it during Q2 2022, FactSet noted in a recent report. You might expect this to start rising after Delta and American Airlines issued fuel-cost-related profit warnings, but it’s not etched in stone. While fuel costs form a healthy portion of airline expenses, they’re generally less of a factor now for both companies and consumers than they were 20 or 40 years ago. Energy and gas spending as a percent of consumption has been in a secular downtrend, notes Kevin Gordon, senior investment strategist at Schwab. Even during the 2022 oil pop, the percentage only went up to 3.3%, which was still half of the 1970s level. Still, much of the August growth in U.S. Retail Sales appeared driven by spending at gas stations. Sales only rose 0.1% last month if you subtract gas stations, food services, building materials, and car sales. This slowdown, possibly reflecting a trend where consumers spend less on other things when gas prices rise, could give the Fed a cleaner path to avoid raising rates in November.
Calendar
Sept. 20: FOMC decision and expected earnings from General Mills (GIS), KB Home (KBH), and FedEx (FDX).
Sept. 21: August Existing Home Sales, August Leading Indicators, and expected earnings from Darden Restaurants (DRI).
Sept. 22: No major earnings or economic data.
Sept. 25: No major earnings or economic data.
Sept. 26: September Consumer Confidence, August New Home Sales, and expected earnings from Costco (COST).
TD Ameritrade® commentary for educational purposes only. Member SIPC.
Image sourced from Shutterstock
This post contains sponsored content. This content is for informational purposes only and not intended to be investing advice.
© 2024 Benzinga.com. Benzinga does not provide investment advice. All rights reserved.
Trade confidently with insights and alerts from analyst ratings, free reports and breaking news that affects the stocks you care about.

