


(Friday market open) Hotter-than-expected July wholesale price data released this morning kept the pressure on stocks and sent Treasury yields up another notch ahead of Friday’s opening bell.
The July Producer Price Index (PPI) came in above Wall Street’s expectations, showing 0.3% monthly growth in both headline and core PPI for July versus the 0.2% analysts had expected. On an annual basis, PPI rose 0.8% compared with the 0.7% average estimate, while core PPI rose 2.4% annually versus the 2.3% average analyst estimate.
Upward traction hasn’t been easy for stocks lately, with rallies failing several times in the last week. This could reflect historically firm valuations and lack of major catalysts as earnings season subsides. Recent agency downgrades to banks and U.S. credit also injected anxiety. The 10-year Treasury note yield has been stalwart this week, recovering from a slow start yesterday and helping to stamp out Wall Street’s early enthusiasm.
The so-called mega-cap tech and communication services stocks were down slightly in premarket trading today. These companies have frequently helped set overall market direction lately.
Morning rush
- The 10-year Treasury note yield (TNX) rose 5 basis points to 4.14% after the PPI data.
- The U.S. Dollar Index ($DXY) is steady at 102.69.
- Cboe Volatility Index® (VIX) futures are near unchanged at 15.98.
- WTI Crude Oil (/CL) inched up to $83.43 per barrel.
Just in
The July PPI data wasn’t completely bearish. The government revised June’s core PPI reading to -0.1% from the previous +0.1% and said June’s headline reading was flat. Still, there were some concerning elements.
First, the July numbers rebounded from June. That’s a sign that inflation growth can return even after being tamed, though we’re just talking about a single report so it’s not necessarily a trend. Even so, that might unnerve some investors and get the Federal Reserve’s attention.
Second, services prices continue to show strength. July saw services prices rise 0.5% for the month—the biggest increase since August 2022. The Fed’s been uneasily watching services growth throughout the economy, and today’s report is another sign that the mission isn’t necessarily accomplished in bringing down this inflationary element.
Stocks in Spotlight
The earnings beat: Q2 results generally looked decent but not outstanding, which also helps explain why the major indexes haven’t found much traction this month.
- Most of the rally since the start of the year reflects multiple expansion, meaning a rising price-earnings (P/E) ratio. The forward P/E recently stood at 19.1, according to Briefing.com. That’s up from the 10-year average of 17.6 but down from 19.3 going into earnings season.
- Earnings are down year-over-year for the last three quarters including this one, meaning the “P” part of the P/E ratio has risen substantially even as “E” has fallen. Arguably, investors want to see more muscle from the “E” before rewarding companies much more in the way of “P.” That’s especially the case with Treasury yields nearly catching up to the stock market’s earnings yield recently and offering stiff competition for investor dollars, notes Joe Mazzola, director of trader education at Schwab. Earnings yield is the inverse of P/E ratio.
- So far this quarter, roughly 79% of reporting companies beat Wall Street’s average earnings per share (EPS) estimate, while 58% beat on revenue. The EPS beats rate is close to recent norms, but the revenue percentage is lower than usual and the worst for any quarter in six years, perhaps reflecting reduced inflation growth that’s kept companies from raising prices much.
- While that’s good news for consumers, it’s not necessarily so great for companies. We’ll get a weekly update later today from FactSet, including the firm’s latest consensus on where Wall Street expects total EPS to land this quarter. The estimate has climbed recently but remains underwater year-over-year, down 5%. Analysts expect full-year 2023 S&P 500 earnings to be roughly flat compared with 2022.
Big retailers approach the foul line next week, with earnings awaited from Home Depot HD, Target TGT, and Walmart WMT, among others. Consider checking their results for early word on back-to-school shopping demand.
What to Watch
Sentimental ride: The University of Michigan’s Preliminary Consumer Sentiment for August is due out soon after the open. Consensus is for a headline of 70.9, down from the final July figure of 71.6, according to Briefing.com. The July reading was the best since October 2021 and up from 59.2 in May, but well below prepandemic highs.
Expectations is a good category to watch in the report if you want to track optimism. Last month it rose to 68.3, up from below 50 a year ago. Another key sub-category is one-year inflation expectations, which inched up to 3.4% in July from 3.3% in June.
The U.S. government’s July Retail Sales figures are due out on Tuesday and might provide more color as economists await evidence of services spending reaching a peak. Goods spending crested quite a while ago.
Eye on the Fed
Futures trading indicates an 11% probability that the Federal Open Market Committee (FOMC) will raise interest rates by 25 basis points at its September meeting, according to the CME FedWatch Tool. That’s up from 9% yesterday. The probability of rates being 25 basis points higher than they are now after the November meeting is near 30%.
Expectations for rate hikes declined in the wake of yesterday’s CPI report, which didn’t harbor any unpleasant surprises that might detract from widespread expectations for a Fed rate pause.
The monetary policy highlight next week will be Wednesday afternoon’s release of minutes from the July FOMC meeting, when the FOMC unanimously voted to raise rates by a quarter-point to the current target range of between 5.25% and 5.5%—the highest in more than 20 years.
Talking Technicals: The 20-day moving average (MA) near 4,532 remains a barrier for the S&P 500® Index (SPX). The SPX hasn’t closed above the 20-day MA since August 1, and several times in the last week it’s approached or even traded above it intraday before losing steam. That includes Thursday, when it peaked at 4,527 before running into selling pressure. The tech-heavy Nasdaq 100 (NDX) also remains well below its 20-day MA near 15,500. On the other side of the scale, recent heavy-selling days have met buying interest, keeping the SPX above where some analysts see technical support at 4,450. We’ll see if the index continues to ricochet between 4,450 and 4,530. As long as that continues, overall direction could be hard to glean.
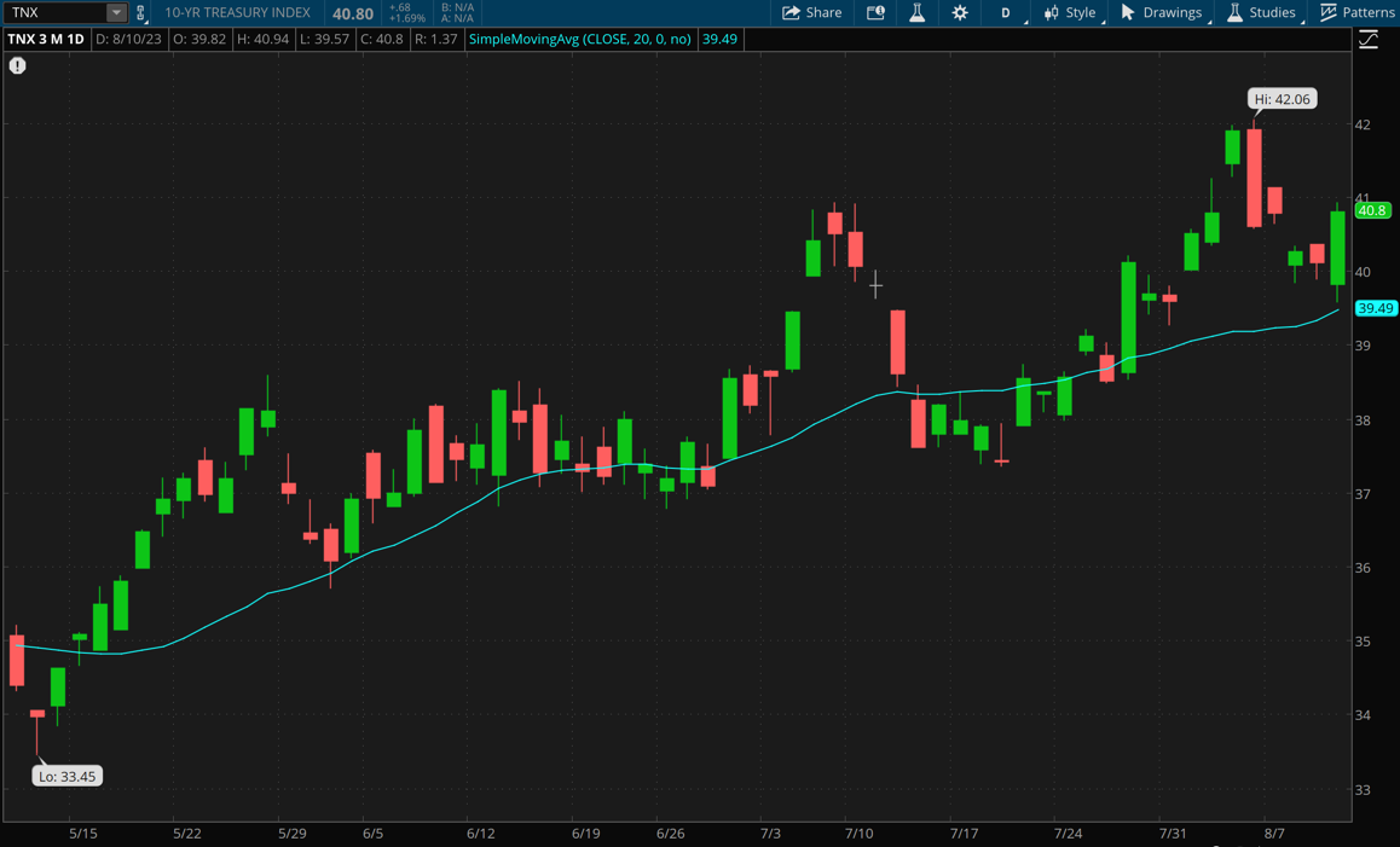
CHART OF THE DAY: OUTSIDE THE LINES. Here’s something not seen often. The 10-year Treasury yield had an “outside day” on the charts Thursday. That means it fell under Wednesday’s low at one point before rallying to close above Wednesday’s high. This rebound appeared to weigh on stocks as the day continued, and may spill over as a bearish influence today. Data source: Cboe.. Chart source: The thinkorswim® platform from TD Ameritrade. For illustrative purposes only. Past performance does not guarantee future results.
Thinking cap
Ideas to mull as you trade or invest
Pause and reflect: The next FOMC meeting September 19–20 is still more than a month away, and between now and then we’ll get a host of inflation and jobs data. That’s why it’s premature to get too excited by yesterday’s CPI report. The current high probability of a rate pause, per the CME FedWatch Tool, can change substantially based not just on the data but also on what Fed Chairman Jerome Powell says later this month in Jackson Hole, where he will speak at an annual economic symposium. Even after the CPI report, San Francisco Fed President Mary Daly said the Fed needs to do more to fight inflation. Still, the market continues building in chances of rate cuts in 2024. There’s now around a 60% chance of at least one 25-basis-point rate decrease by the March 2024 FOMC meeting, and close to 100% probability of rates being lower a year from now than they are now, according to the CME tool.
Credit check: The recent downgrade of several U.S. regional banks by Moody’s shifted focus back to the credit market. When banks come under the gun, they’re often less willing to accept loans that might not get repaid. That could raise the cost of borrowing, especially for less well-capitalized companies with weaker credit ratings. It’s only been a few days since the Moody’s news, so it’s too early to reach any conclusions on the credit impact. So far, it looks like credit spreads—the gap between the rates banks lend at and U.S. Treasury yields—haven’t widened much. The average spread for investment grade debt stands at +123 basis points, and the average spread for high yield debt is +394 basis points. That’s up from the tightest levels of the year, but only by 12 basis points on the week. This is worth watching in coming weeks to get a sense of the lending environment. Any steep climb in spreads could indicate more difficulty for companies seeking credit, which in turn could weigh on economic growth. The Fed’s July Senior Loan Officers Survey suggested credit conditions have tightened and demand has weakened for loans to businesses and households.
Go play outside: The 10-year Treasury note yield experienced what’s known in the markets as an “outside day” on the charts Thursday, meaning it dipped below Wednesday’s low at one point before rallying to close above Wednesday’s high. From a technical perspective, that looked negative and might have implications today for stocks, which remain very sensitive to yields at these high levels. Perhaps significantly, Thursday’s early strength in Treasuries, which move opposite of yields, didn’t push the 10-year yield down to its 20-day moving average near 3.95%. Failure to push to that technical support level might have triggered selling in Treasuries.
Calendar
Aug. 14: No major earnings or data expected.
Aug. 15: July Retail Sales, August Empire State Manufacturing, and expected earnings from Cardinal Health (CAH) and Home Depot (HD).
Aug. 16: July Housing Starts and Building Permits, and expected earnings from Target (TGT) and Cisco (CSCO).
Aug. 17: July Leading Economic Indicators and expected earnings from Walmart (WMT), Applied Materials (AMAT), and Ross Stores (ROSS).
Aug. 18: Expected earnings from Deere (DE) and Estee Lauder (EL).
TD Ameritrade® commentary for educational purposes only. Member SIPC.
Image sourced from Shutterstock
This post contains sponsored content. This content is for informational purposes only and not intended to be investing advice.
© 2024 Benzinga.com. Benzinga does not provide investment advice. All rights reserved.
Trade confidently with insights and alerts from analyst ratings, free reports and breaking news that affects the stocks you care about.

