


During the last three months, 5 analysts shared their evaluations of Baker Hughes BKR, revealing diverse outlooks from bullish to bearish.
The table below provides a snapshot of their recent ratings, showcasing how sentiments have evolved over the past 30 days and comparing them to the preceding months.
| Bullish | Somewhat Bullish | Indifferent | Somewhat Bearish | Bearish | |
|---|---|---|---|---|---|
| Total Ratings | 1 | 4 | 0 | 0 | 0 |
| Last 30D | 0 | 1 | 0 | 0 | 0 |
| 1M Ago | 0 | 0 | 0 | 0 | 0 |
| 2M Ago | 0 | 0 | 0 | 0 | 0 |
| 3M Ago | 1 | 3 | 0 | 0 | 0 |
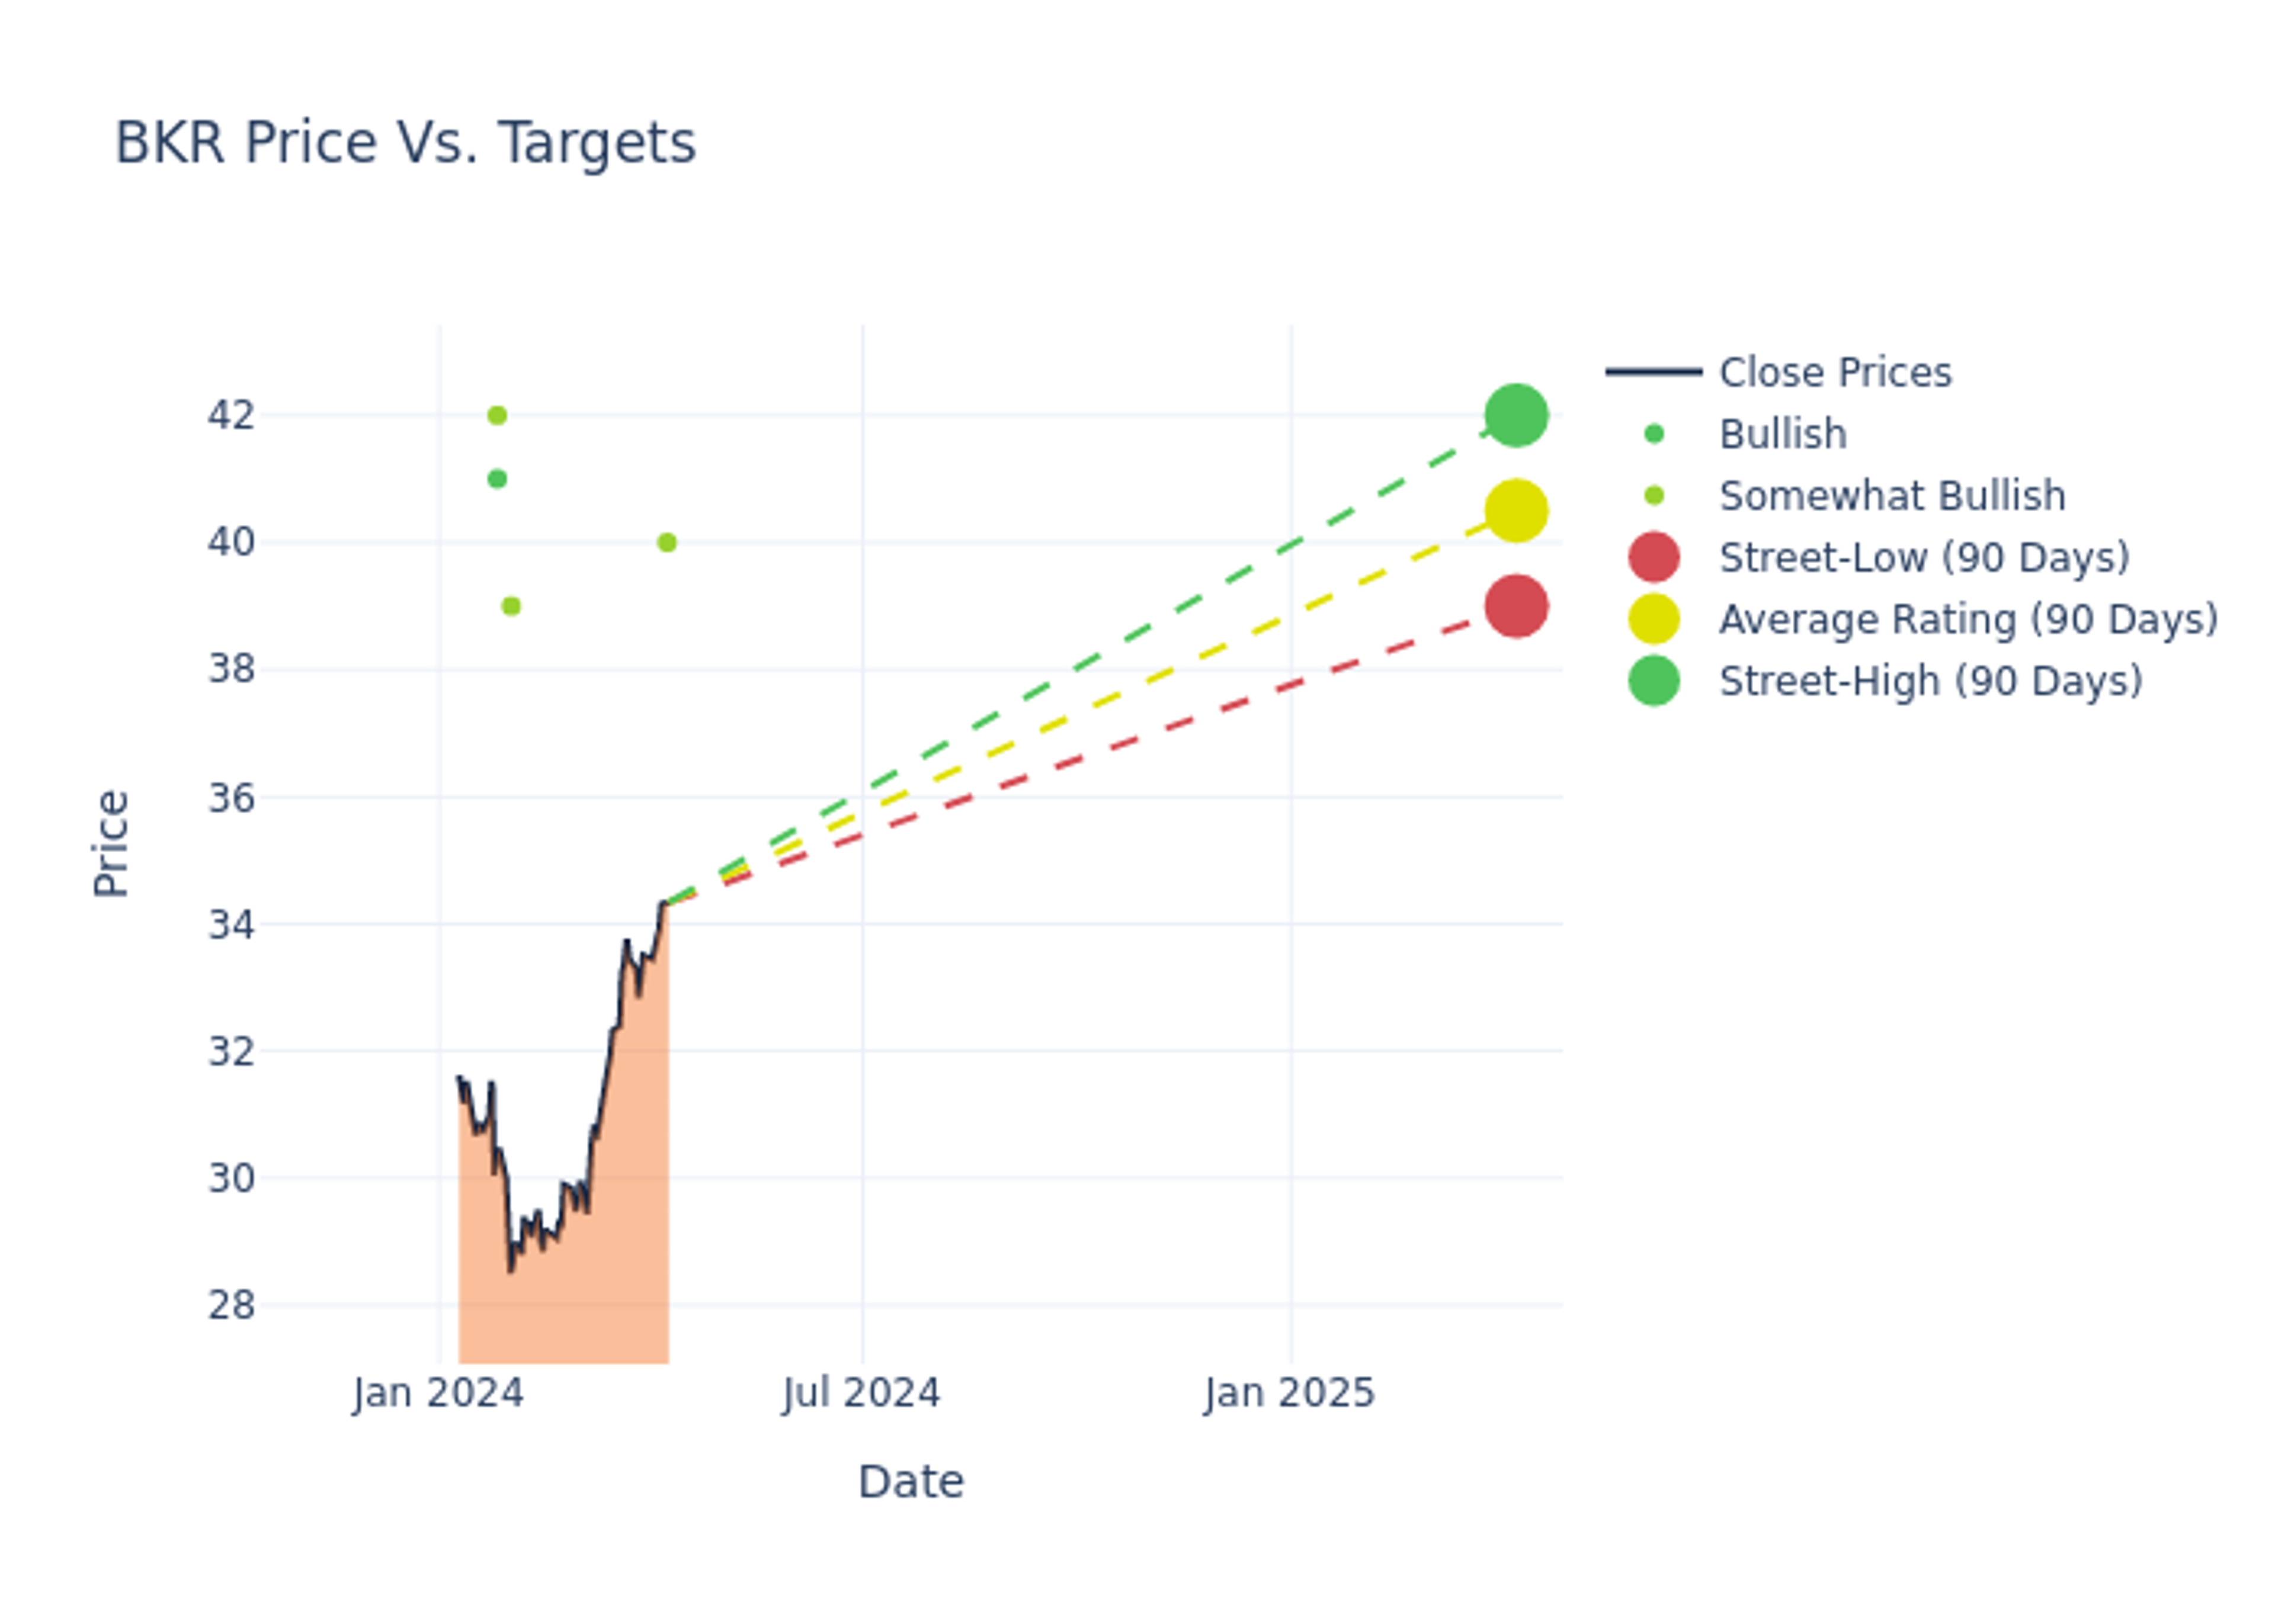
In the assessment of 12-month price targets, analysts unveil insights for Baker Hughes, presenting an average target of $40.2, a high estimate of $42.00, and a low estimate of $39.00. This current average represents a 5.41% decrease from the previous average price target of $42.50.

Deciphering Analyst Ratings: An In-Depth Analysis
The perception of Baker Hughes by financial experts is analyzed through recent analyst actions. The following summary presents key analysts, their recent evaluations, and adjustments to ratings and price targets.
| Analyst | Analyst Firm | Action Taken | Rating | Current Price Target | Prior Price Target |
|---|---|---|---|---|---|
| Charles Minervino | Susquehanna | Maintains | Positive | $40.00 | - |
| Keith Mackey | RBC Capital | Maintains | Outperform | $39.00 | - |
| David Anderson | Barclays | Lowers | Overweight | $42.00 | $43.00 |
| Scott Gruber | Citigroup | Lowers | Buy | $41.00 | $42.00 |
| Keith Mackey | RBC Capital | Maintains | Outperform | $39.00 | - |
Key Insights:
- Action Taken: Analysts frequently update their recommendations based on evolving market conditions and company performance. Whether they 'Maintain', 'Raise' or 'Lower' their stance, it reflects their reaction to recent developments related to Baker Hughes. This information provides a snapshot of how analysts perceive the current state of the company.
- Rating: Analysts assign qualitative assessments to stocks, ranging from 'Outperform' to 'Underperform'. These ratings convey the analysts' expectations for the relative performance of Baker Hughes compared to the broader market.
- Price Targets: Understanding forecasts, analysts offer estimates for Baker Hughes's future value. Examining the current and prior targets provides insight into analysts' changing expectations.
Understanding these analyst evaluations alongside key financial indicators can offer valuable insights into Baker Hughes's market standing. Stay informed and make well-considered decisions with our Ratings Table.
Stay up to date on Baker Hughes analyst ratings.
Discovering Baker Hughes: A Closer Look
Baker Hughes is a global leader in oilfield services and oilfield equipment, with particularly strong presences in the artificial lift, specialty chemicals, and completions markets. It maintains modest exposure to offshore oil and gas production. The other half of its business focuses on industrial power generation, process solutions, and industrial asset management, with high exposure to the liquid natural gas market specifically, as well as broader industrials end markets.
Financial Insights: Baker Hughes
Market Capitalization Analysis: With a profound presence, the company's market capitalization is above industry averages. This reflects substantial size and strong market recognition.
Revenue Growth: Baker Hughes's revenue growth over a period of 3 months has been noteworthy. As of 31 December, 2023, the company achieved a revenue growth rate of approximately 15.75%. This indicates a substantial increase in the company's top-line earnings. As compared to competitors, the company surpassed expectations with a growth rate higher than the average among peers in the Energy sector.
Net Margin: Baker Hughes's net margin falls below industry averages, indicating challenges in achieving strong profitability. With a net margin of 6.44%, the company may face hurdles in effective cost management.
Return on Equity (ROE): Baker Hughes's ROE lags behind industry averages, suggesting challenges in maximizing returns on equity capital. With an ROE of 2.87%, the company may face hurdles in achieving optimal financial performance.
Return on Assets (ROA): Baker Hughes's ROA lags behind industry averages, suggesting challenges in maximizing returns from its assets. With an ROA of 1.2%, the company may face hurdles in achieving optimal financial performance.
Debt Management: Baker Hughes's debt-to-equity ratio is below industry norms, indicating a sound financial structure with a ratio of 0.39.
The Basics of Analyst Ratings
Benzinga tracks 150 analyst firms and reports on their stock expectations. Analysts typically arrive at their conclusions by predicting how much money a company will make in the future, usually the upcoming five years, and how risky or predictable that company's revenue streams are.
Analysts attend company conference calls and meetings, research company financial statements, and communicate with insiders to publish their ratings on stocks. Analysts typically rate each stock once per quarter or whenever the company has a major update.
Analysts may enhance their evaluations by incorporating forecasts for metrics like growth estimates, earnings, and revenue, delivering additional guidance to investors. It is vital to acknowledge that, although experts in stocks and sectors, analysts are human and express their opinions when providing insights.
This article was generated by Benzinga's automated content engine and reviewed by an editor.
© 2024 Benzinga.com. Benzinga does not provide investment advice. All rights reserved.
date | ticker | name | Price Target | Upside/Downside | Recommendation | Firm |
|---|
Trade confidently with insights and alerts from analyst ratings, free reports and breaking news that affects the stocks you care about.

