


Throughout the last three months, 5 analysts have evaluated State Street STT, offering a diverse set of opinions from bullish to bearish.
The table below offers a condensed view of their recent ratings, showcasing the changing sentiments over the past 30 days and comparing them to the preceding months.
| Bullish | Somewhat Bullish | Indifferent | Somewhat Bearish | Bearish | |
|---|---|---|---|---|---|
| Total Ratings | 0 | 1 | 4 | 0 | 0 |
| Last 30D | 0 | 1 | 0 | 0 | 0 |
| 1M Ago | 0 | 0 | 0 | 0 | 0 |
| 2M Ago | 0 | 0 | 0 | 0 | 0 |
| 3M Ago | 0 | 0 | 4 | 0 | 0 |
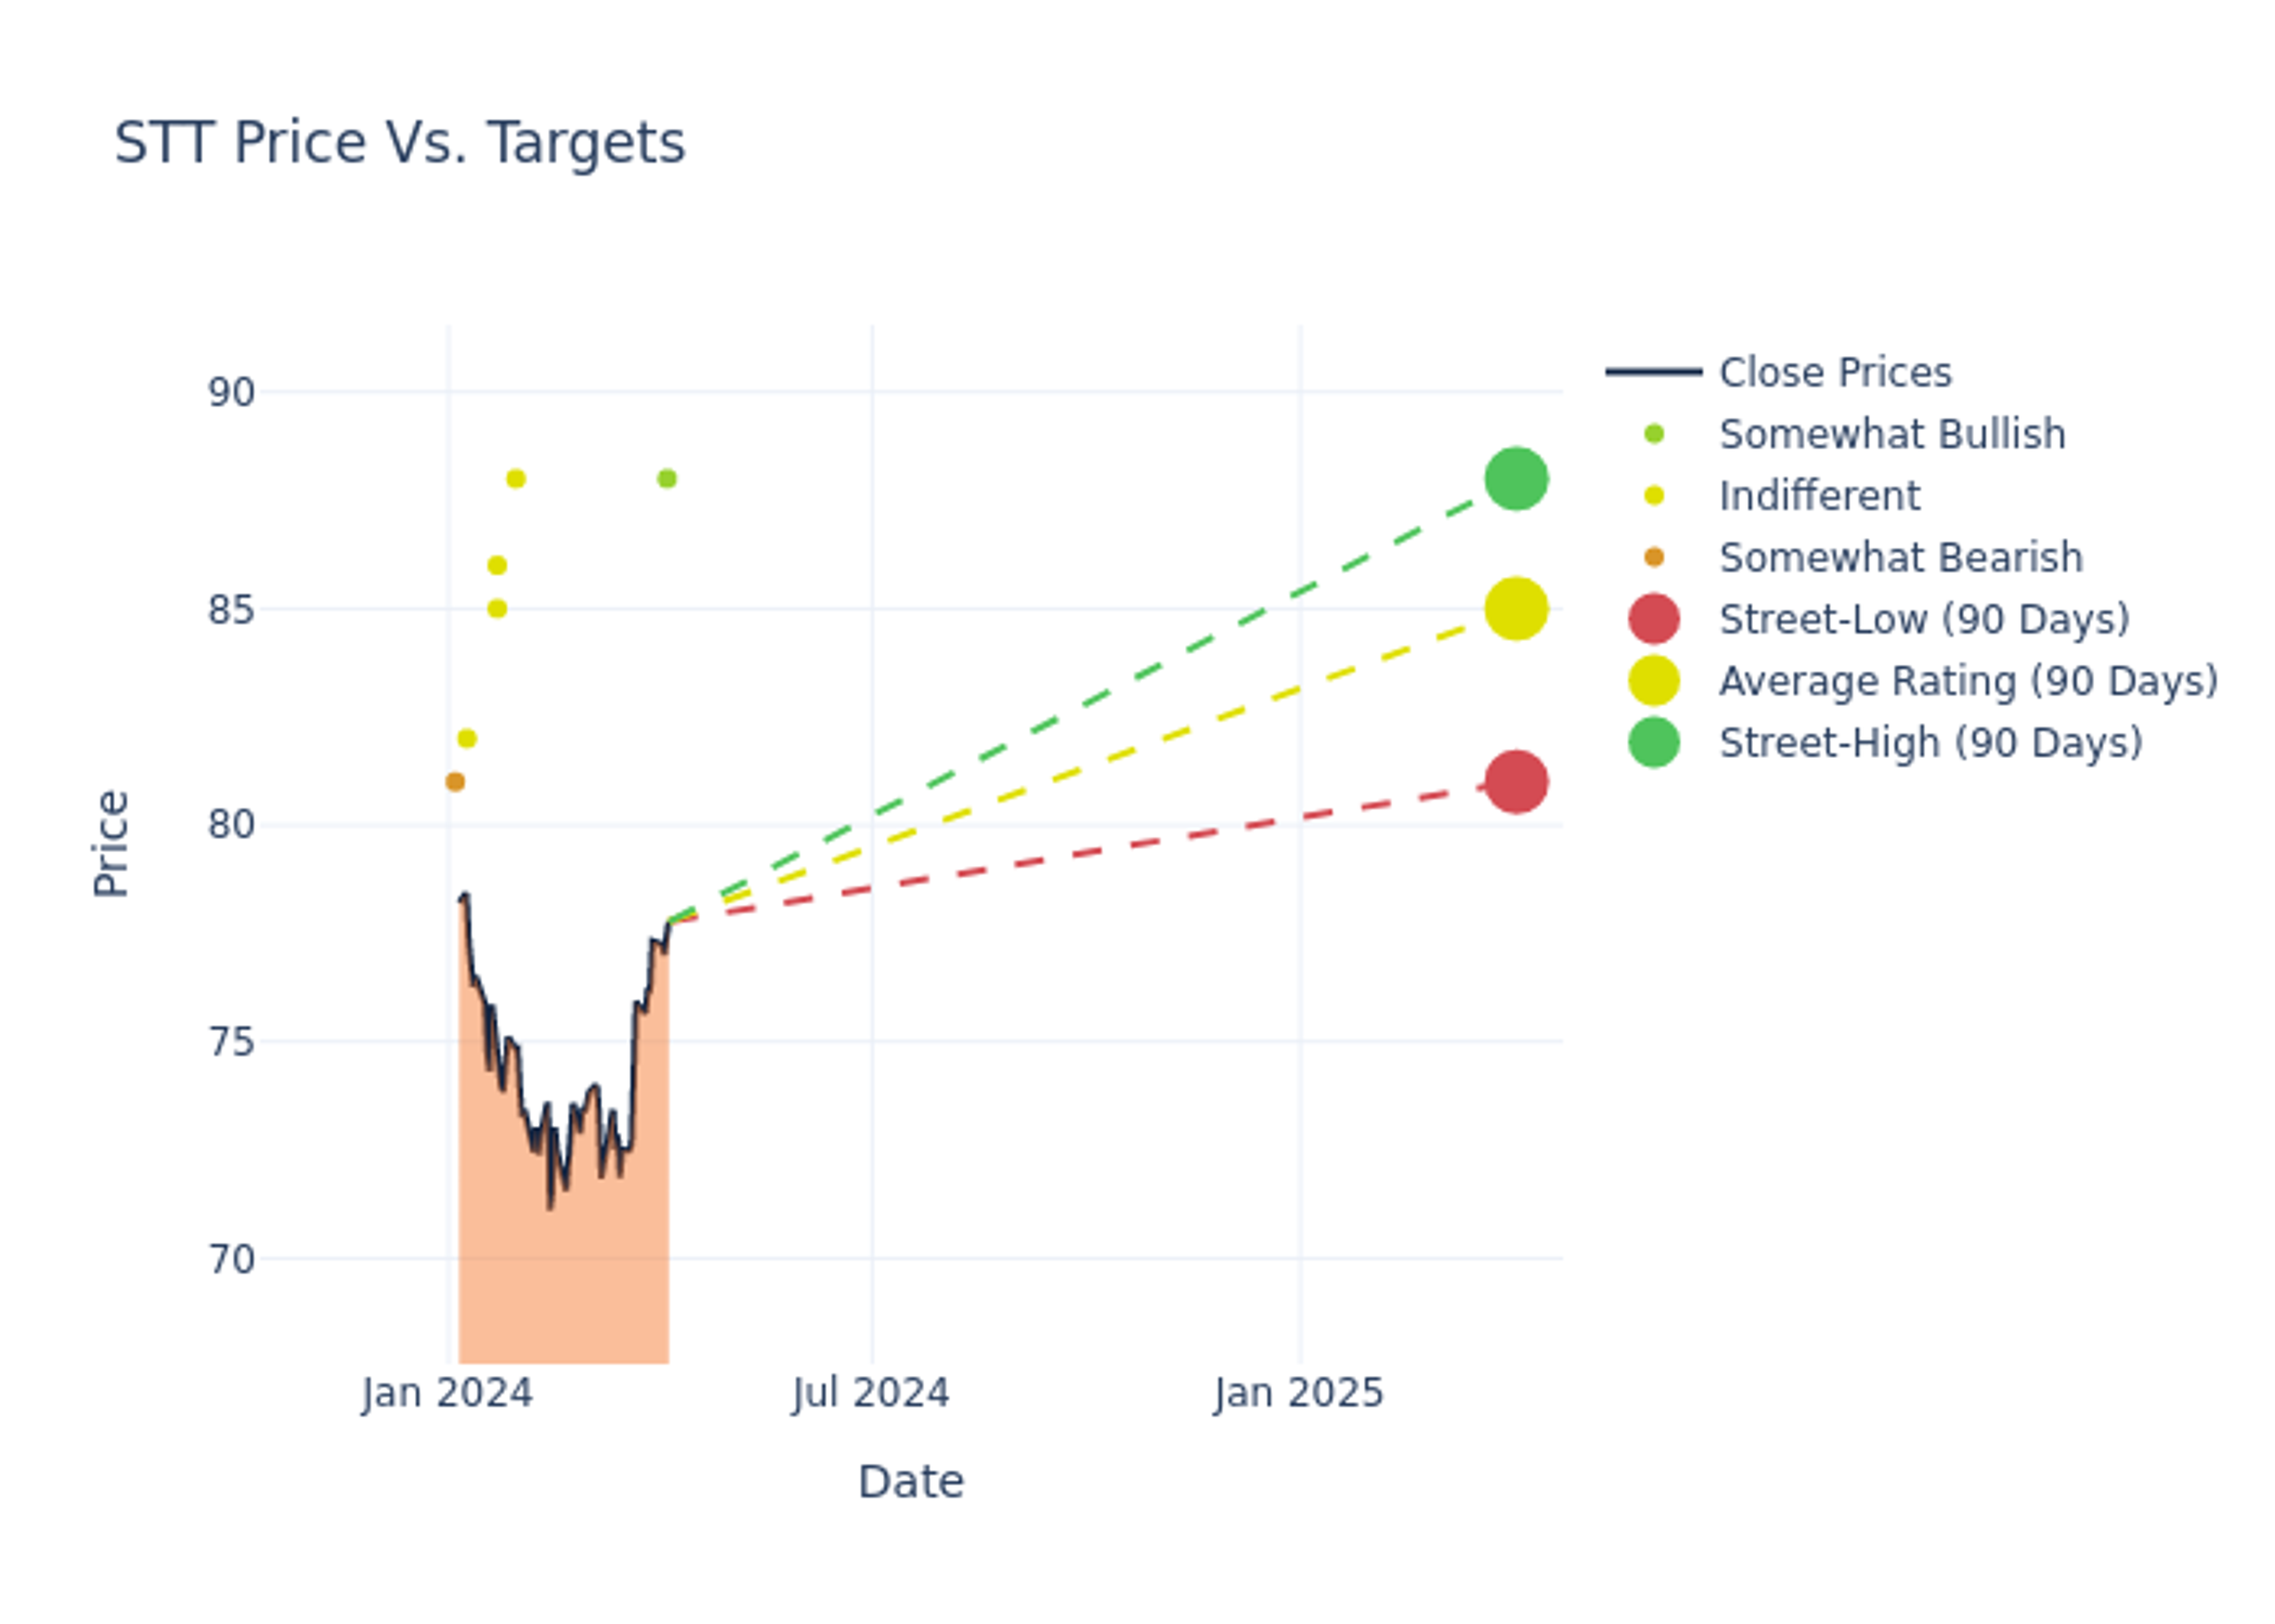
Analysts' evaluations of 12-month price targets offer additional insights, showcasing an average target of $85.8, with a high estimate of $88.00 and a low estimate of $82.00. Surpassing the previous average price target of $80.40, the current average has increased by 6.72%.

Breaking Down Analyst Ratings: A Detailed Examination
The analysis of recent analyst actions sheds light on the perception of State Street by financial experts. The following summary presents key analysts, their recent evaluations, and adjustments to ratings and price targets.
| Analyst | Analyst Firm | Action Taken | Rating | Current Price Target | Prior Price Target |
|---|---|---|---|---|---|
| Glenn Schorr | Evercore ISI Group | Raises | Outperform | $88.00 | $85.00 |
| Connor Lynagh | Morgan Stanley | Raises | Equal-Weight | $88.00 | $83.00 |
| Gerard Cassidy | RBC Capital | Raises | Sector Perform | $85.00 | $75.00 |
| Michael Brown | Keefe, Bruyette & Woods | Lowers | Market Perform | $86.00 | $89.00 |
| Brennan Hawken | UBS | Raises | Neutral | $82.00 | $70.00 |
Key Insights:
- Action Taken: Analysts adapt their recommendations to changing market conditions and company performance. Whether they 'Maintain', 'Raise' or 'Lower' their stance, it reflects their response to recent developments related to State Street. This information provides a snapshot of how analysts perceive the current state of the company.
- Rating: Analysts unravel qualitative evaluations for stocks, ranging from 'Outperform' to 'Underperform'. These ratings offer insights into expectations for the relative performance of State Street compared to the broader market.
- Price Targets: Analysts provide insights into price targets, offering estimates for the future value of State Street's stock. This comparison reveals trends in analysts' expectations over time.
Understanding these analyst evaluations alongside key financial indicators can offer valuable insights into State Street's market standing. Stay informed and make well-considered decisions with our Ratings Table.
Stay up to date on State Street analyst ratings.
About State Street
State Street is a leading provider of financial services, including investment servicing, investment management, and investment research and trading. With approximately $42 trillion in assets under custody and administration and $4.1 trillion assets under management as of Dec. 31, 2023, State Street operates globally in more than 100 geographic markets and employs more than 46,000 worldwide.
State Street: Delving into Financials
Market Capitalization Perspectives: The company's market capitalization falls below industry averages, signaling a relatively smaller size compared to peers. This positioning may be influenced by factors such as perceived growth potential or operational scale.
Revenue Growth: State Street's revenue growth over a period of 3 months has faced challenges. As of 31 December, 2023, the company experienced a revenue decline of approximately -2.84%. This indicates a decrease in the company's top-line earnings. As compared to its peers, the revenue growth lags behind its industry peers. The company achieved a growth rate lower than the average among peers in Financials sector.
Net Margin: State Street's net margin lags behind industry averages, suggesting challenges in maintaining strong profitability. With a net margin of 5.65%, the company may face hurdles in effective cost management.
Return on Equity (ROE): State Street's ROE is below industry standards, pointing towards difficulties in efficiently utilizing equity capital. With an ROE of 0.79%, the company may encounter challenges in delivering satisfactory returns for shareholders.
Return on Assets (ROA): State Street's ROA falls below industry averages, indicating challenges in efficiently utilizing assets. With an ROA of 0.06%, the company may face hurdles in generating optimal returns from its assets.
Debt Management: With a below-average debt-to-equity ratio of 0.99, State Street adopts a prudent financial strategy, indicating a balanced approach to debt management.
How Are Analyst Ratings Determined?
Ratings come from analysts, or specialists within banking and financial systems that report for specific stocks or defined sectors (typically once per quarter for each stock). Analysts usually derive their information from company conference calls and meetings, financial statements, and conversations with important insiders to reach their decisions.
Beyond their standard evaluations, some analysts contribute predictions for metrics like growth estimates, earnings, and revenue, furnishing investors with additional guidance. Users of analyst ratings should be mindful that this specialized advice is shaped by human perspectives and may be subject to variability.
This article was generated by Benzinga's automated content engine and reviewed by an editor.
© 2024 Benzinga.com. Benzinga does not provide investment advice. All rights reserved.
date | ticker | name | Price Target | Upside/Downside | Recommendation | Firm |
|---|
Trade confidently with insights and alerts from analyst ratings, free reports and breaking news that affects the stocks you care about.

