

Analysts' ratings for Kennametal (NYSE:KMT) over the last quarter vary from bullish to bearish, as provided by 4 analysts.
The following table summarizes their recent ratings, shedding light on the changing sentiments within the past 30 days and comparing them to the preceding months.
| Bullish | Somewhat Bullish | Indifferent | Somewhat Bearish | Bearish | |
|---|---|---|---|---|---|
| Total Ratings | 0 | 0 | 3 | 1 | 0 |
| Last 30D | 0 | 0 | 1 | 0 | 0 |
| 1M Ago | 0 | 0 | 0 | 0 | 0 |
| 2M Ago | 0 | 0 | 1 | 1 | 0 |
| 3M Ago | 0 | 0 | 1 | 0 | 0 |
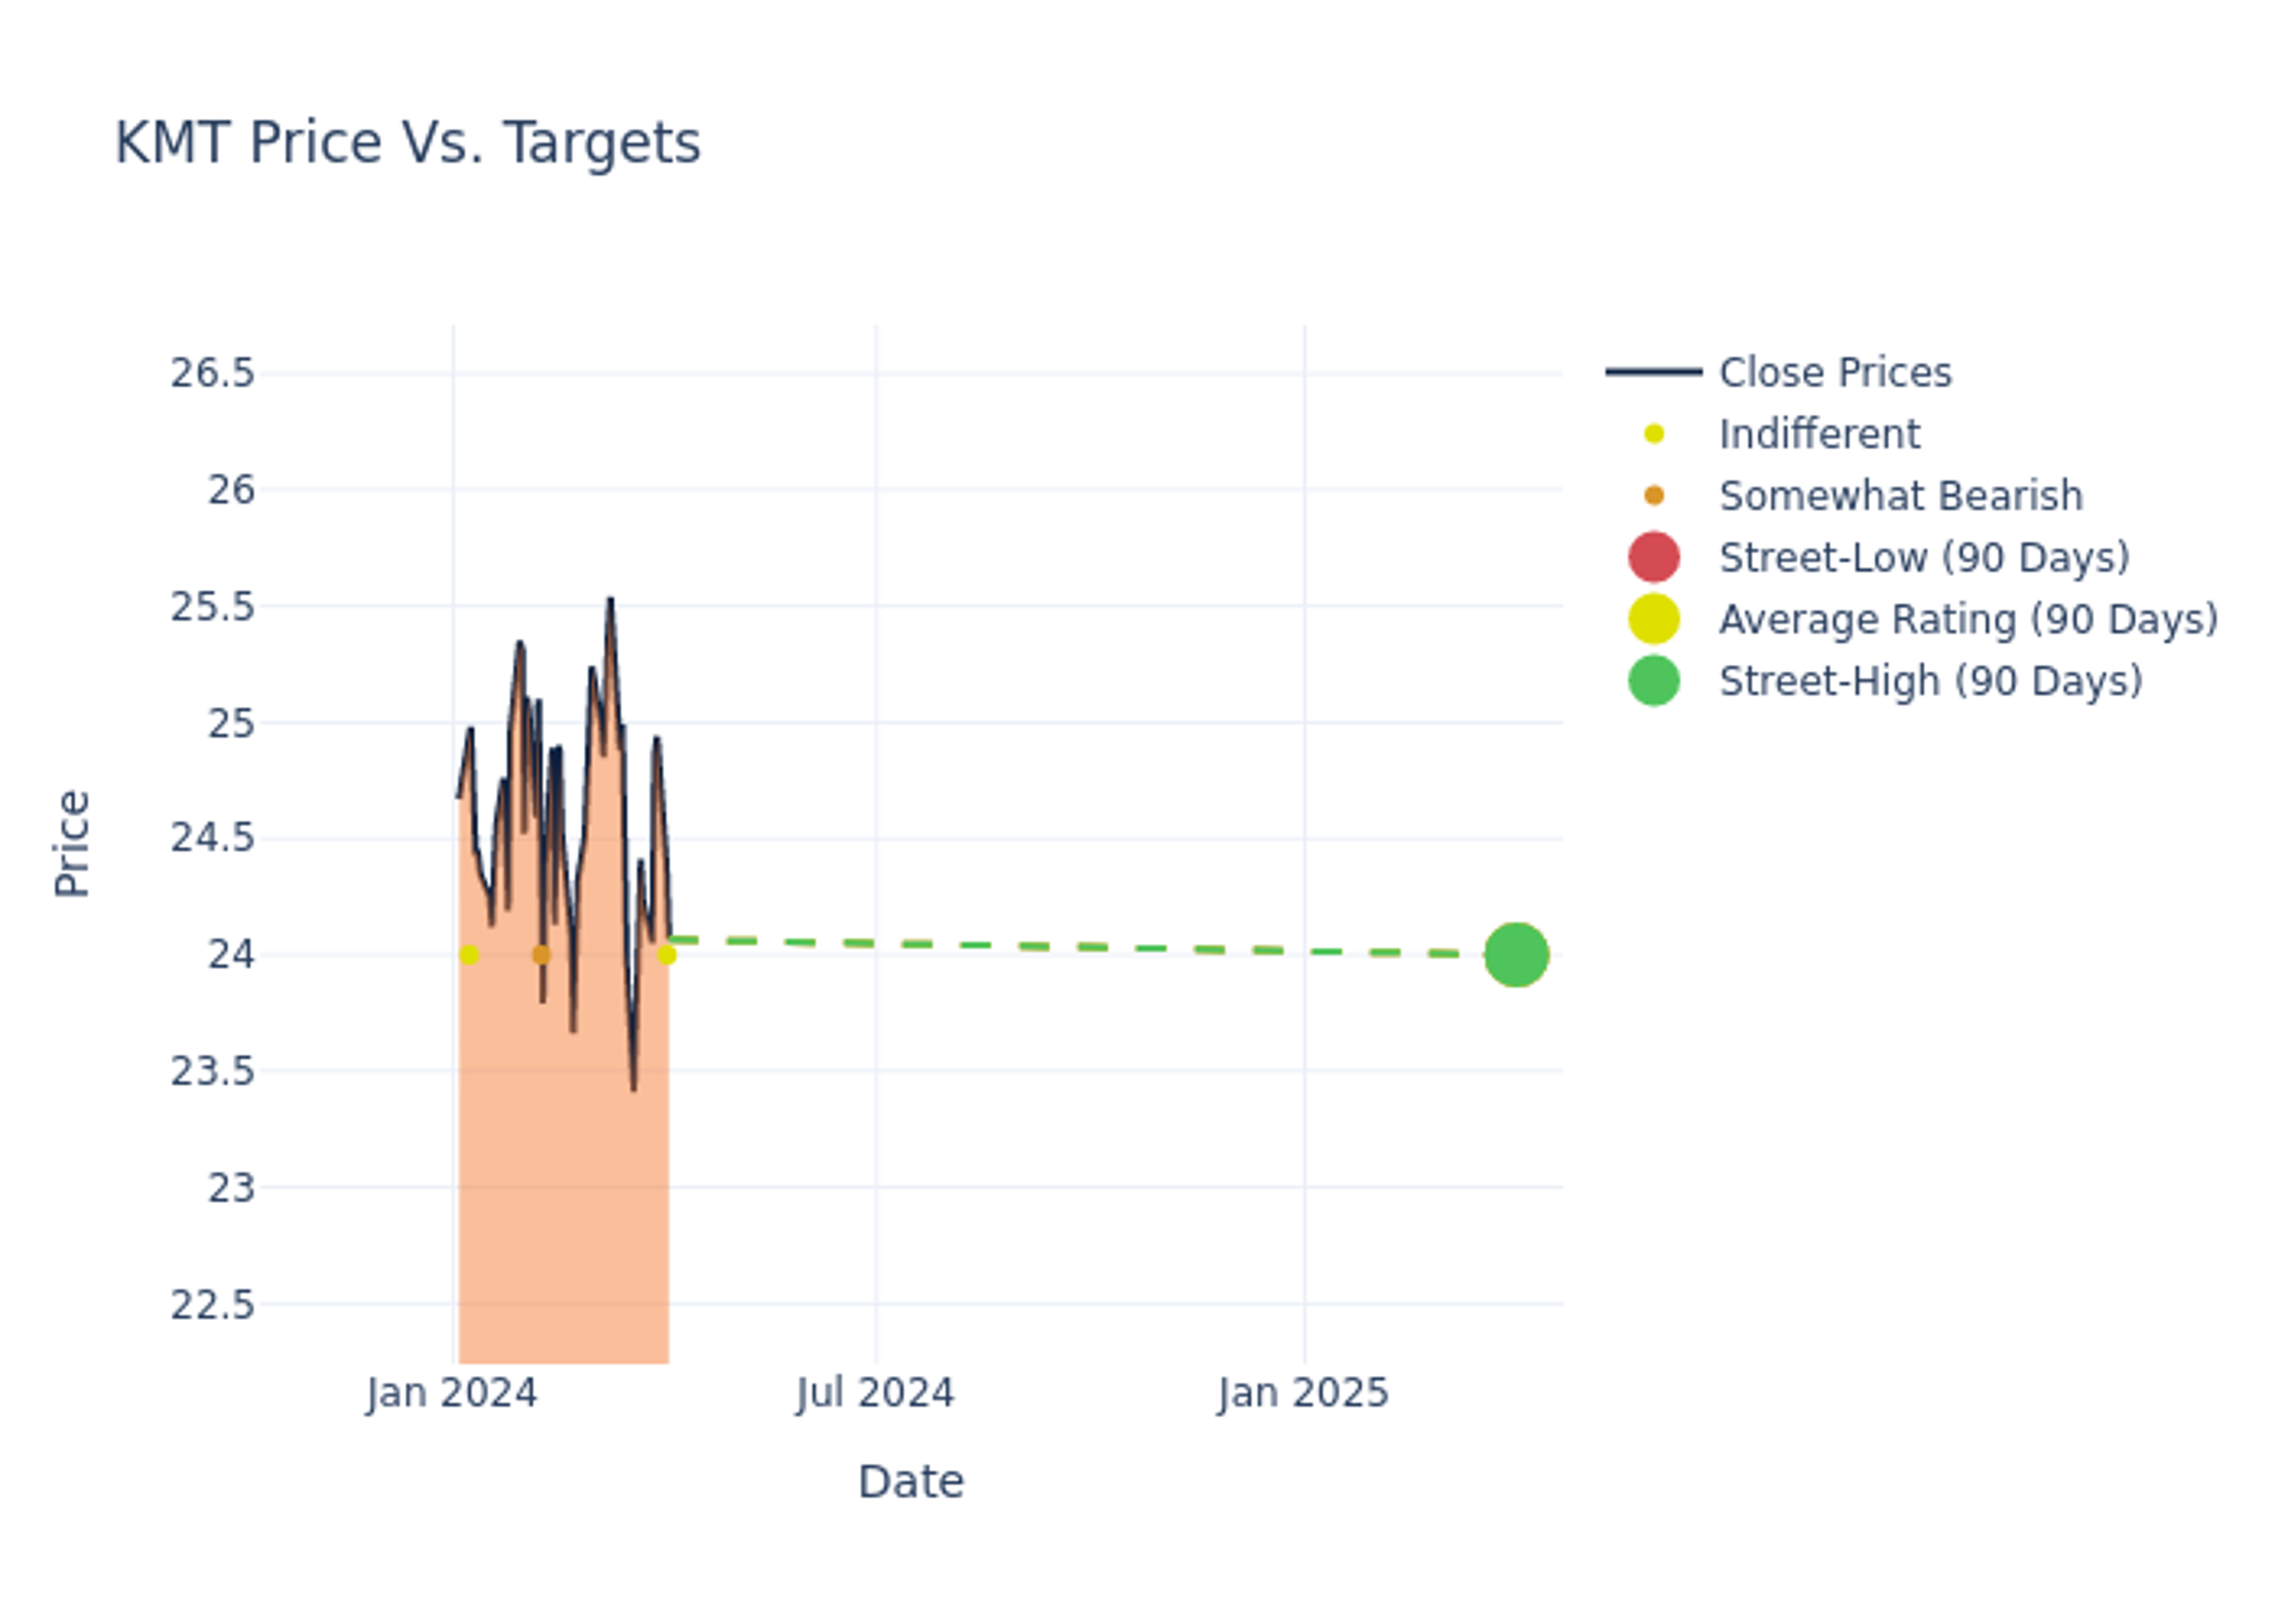
The 12-month price targets assessed by analysts reveal further insights, featuring an average target of $24.25, a high estimate of $25.00, and a low estimate of $24.00. A decline of 5.53% from the prior average price target is evident in the current average.

Deciphering Analyst Ratings: An In-Depth Analysis
In examining recent analyst actions, we gain insights into how financial experts perceive Kennametal. The following summary outlines key analysts, their recent evaluations, and adjustments to ratings and price targets.
| Analyst | Analyst Firm | Action Taken | Rating | Current Price Target | Prior Price Target |
|---|---|---|---|---|---|
| Julian Mitchell | Barclays | Lowers | Equal-Weight | $24.00 | $25.00 |
| Tami Zakaria | JP Morgan | Lowers | Underweight | $24.00 | $26.00 |
| Julian Mitchell | Barclays | Lowers | Equal-Weight | $25.00 | $26.00 |
| Angel Castillo | Morgan Stanley | Announces | Equal-Weight | $24.00 | - |
Key Insights:
- Action Taken: Analysts respond to changes in market conditions and company performance, frequently updating their recommendations. Whether they 'Maintain', 'Raise' or 'Lower' their stance, it reflects their reaction to recent developments related to Kennametal. This information offers a snapshot of how analysts perceive the current state of the company.
- Rating: Analyzing trends, analysts offer qualitative evaluations, ranging from 'Outperform' to 'Underperform'. These ratings convey expectations for the relative performance of Kennametal compared to the broader market.
- Price Targets: Analysts explore the dynamics of price targets, providing estimates for the future value of Kennametal's stock. This examination reveals shifts in analysts' expectations over time.
To gain a panoramic view of Kennametal's market performance, explore these analyst evaluations alongside essential financial indicators. Stay informed and make judicious decisions using our Ratings Table.
Stay up to date on Kennametal analyst ratings.
If you are interested in following small-cap stock news and performance you can start by tracking it here.
About Kennametal
Kennametal Inc is a manufacturer of metalworking tools and wear-resistant engineered components and coatings. The company operates in two business segments: Metal Cutting and infrastructure. It generates maximum revenue from the Metal Cutting segment. The Metal Cutting segment develops and manufactures high performance tooling and metal cutting products and services and offers an assortment of standard and custom metal cutting solutions to diverse end markets, including aerospace, general engineering, energy, and transportation. Geographically, it derives a majority of revenue from the United States.
Kennametal's Economic Impact: An Analysis
Market Capitalization Analysis: The company's market capitalization is below the industry average, suggesting that it is relatively smaller compared to peers. This could be due to various factors, including perceived growth potential or operational scale.
Decline in Revenue: Over the 3 months period, Kennametal faced challenges, resulting in a decline of approximately -0.36% in revenue growth as of 31 December, 2023. This signifies a reduction in the company's top-line earnings. When compared to others in the Industrials sector, the company faces challenges, achieving a growth rate lower than the average among peers.
Net Margin: Kennametal's financial strength is reflected in its exceptional net margin, which exceeds industry averages. With a remarkable net margin of 4.67%, the company showcases strong profitability and effective cost management.
Return on Equity (ROE): The company's ROE is a standout performer, exceeding industry averages. With an impressive ROE of 1.81%, the company showcases effective utilization of equity capital.
Return on Assets (ROA): The company's ROA is a standout performer, exceeding industry averages. With an impressive ROA of 0.91%, the company showcases effective utilization of assets.
Debt Management: The company maintains a balanced debt approach with a debt-to-equity ratio below industry norms, standing at 0.52.
The Core of Analyst Ratings: What Every Investor Should Know
Ratings come from analysts, or specialists within banking and financial systems that report for specific stocks or defined sectors (typically once per quarter for each stock). Analysts usually derive their information from company conference calls and meetings, financial statements, and conversations with important insiders to reach their decisions.
Some analysts publish their predictions for metrics such as growth estimates, earnings, and revenue to provide additional guidance with their ratings. When using analyst ratings, it is important to keep in mind that stock and sector analysts are also human and are only offering their opinions to investors.
This article was generated by Benzinga's automated content engine and reviewed by an editor.
© 2025 Benzinga.com. Benzinga does not provide investment advice. All rights reserved.