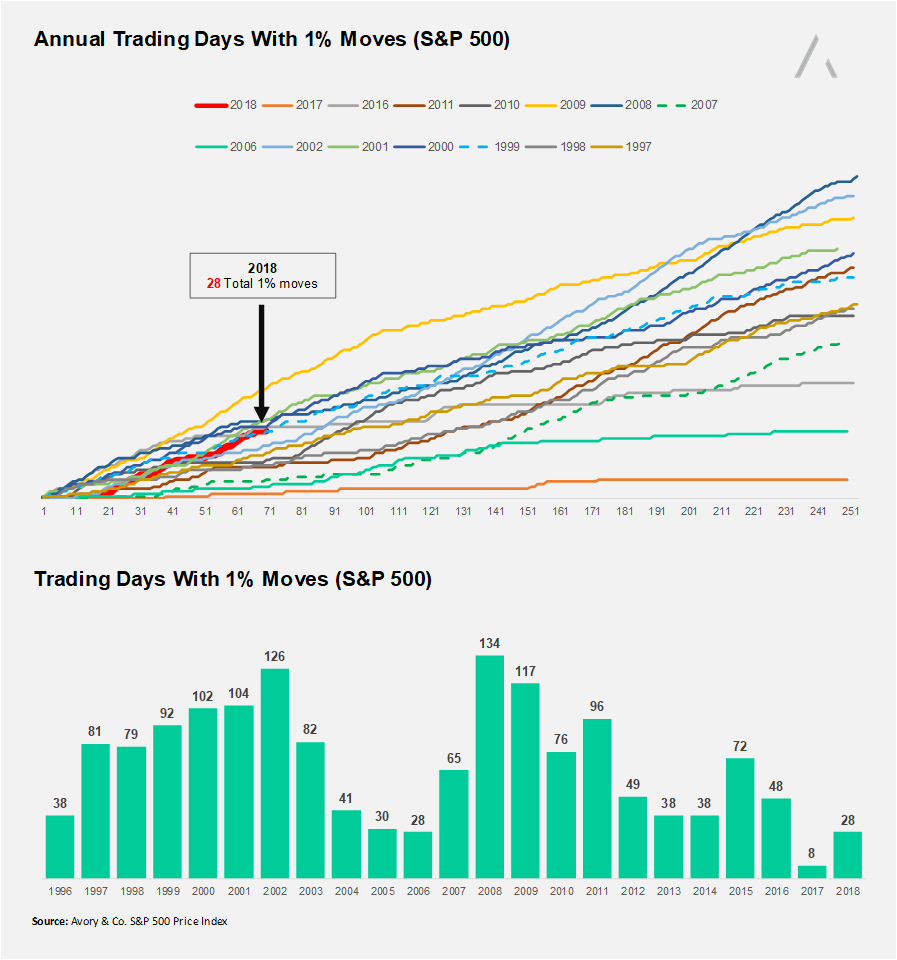
So far in 2018, the narrative has been about volatility. Many outlets have expressed concerns regarding the magnitude of daily moves. In most circumstances, I don't see evidence of that.
First lets be clear, 2017 was not common.
In 2017 there were only 8 days which experienced 1% moves. Both charts highlight the clear outlier 2017 was relative to anytime dating back to 1996. 2017 is the orange line on the top chart. That's an outlier.
This makes me think psychology is playing a bigger role than ever as we are coming off of record complacency, which then exaggerates the feeling of current volatility.
Here's how I view 2018 volatility. On the top chart, we can see how the count of 1% moves stacks up to other years in terms of how many days we are into the year. 2018, which is in RED, is the on the higher end, but I would not consider it to be an outlier.
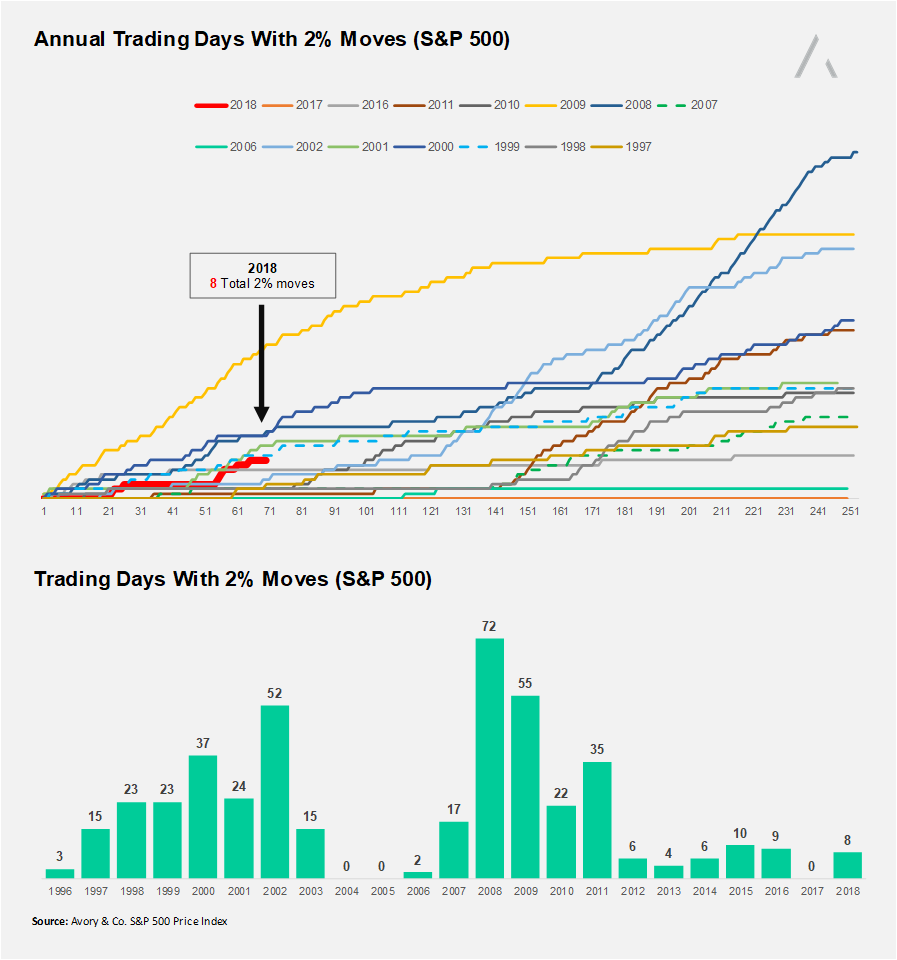
So what about 2% moves?
I haven't seen this chart in the news yet. 2% moves have been uncommon since 2012. Look at 2012 to 2018, compared to 1997 to 2003, and 2006 to 2011. Big differences. Again nothing here suggests that this level of daily moves is unprecedented, nor that it is conditions prior to market crashes.
That's it. Make sure to subscribe to future blog posts.
Disclaimer: This is not a recommendation for purchase or sale of any securities.
AVORY & CO. IS A REGISTERED INVESTMENT ADVISER. INFORMATION PRESENTED IS FOR EDUCATIONAL PURPOSES ONLY. PLEASE SEE FULL DISCLAIMER HERE
© 2024 Benzinga.com. Benzinga does not provide investment advice. All rights reserved.
Comments
Trade confidently with insights and alerts from analyst ratings, free reports and breaking news that affects the stocks you care about.

