


The Markets
Recent market action has been fairly orderly considering the fact that stocks have had a lot on their proverbial minds. Earnings, rates, jobs, credit downgrades, the US Dollar, and on and on. In other words, all the usual suspects.
When examining stock price movements there is a persistent tendency, especially in big media, to declare a reason for the action. People want to know, “Why?” The everpresent question of “why” almost always points to one of a rotating selection of scapegoats. Earnings, rates, jobs, credit downgrades, the US Dollar …….
Waves and Tides
Yields are up because bonds TLT have been getting sold. Amazon AMZN stock is up because the company reported earnings that far exceeded expectations. Volatility VIX jumped because new uncertainties were introduced.
Those are the waves.
Under the surface are macro trends, cycles, and seasonal tendencies. We’ve just gotten past the strongest seasonal period of the four-year election cycle and are moving into a period of weakness.
That is the tide.
It’s often said, “News follows price, not the other way around.” And that is likely what has happened here. The U.S. Debt downgrade was just the catalyst to ignite the selling that was already on the way due to the seasonal tendencies.
The Bullish Percent indexes for SPX and QQQ QQQ were hinting at the start of a pullback two weeks ago.
Bullish Percents getting a little lofty with $QQQ already reversing to a column of Os.
The S&P 500 only being down -2% since the day of the announcement would seem to indicate that it isn’t a big deal. Maybe that changes. But so far that’s the case.
So the question now is, what impact will the seasonal slowdown have?
Was that it?
Will there be a deeper correction?
Or do stocks just drift, chopping back and forth for a while?
That, of course, will only be known in time.
To be clear, stocks are strong. And the big picture case is getting stronger. So this seasonal weakness, unless we are presented with evidence to the contrary, should be regarded as just that; seasonal. The data suggests a pullback, not a nasty bear market.
The best thing for traders and investors to do is to be aware of the tides and don’t swim against them.
SPY SPY and QQQ are below the short-term 8 and 21-day moving averages. So in the short-term, as my friend Brian Shannon likes to say, stocks are guilty until proven innocent.
The Charts
SPY Opened at the 21-day MA and was all over the place today before closing beneath yesterday’s low and the pivot. There is potential support at the next pivot lower, $443.90, and then it’s the 50-day MA near $439.
Again, below the 8 and 21-day MAs means guilty until proven innocent.


QQQ has a glimmer of hope if considering the potential bull flag pattern. Otherwise, a trip to the 50-day MA $366-ish, seems imminent.

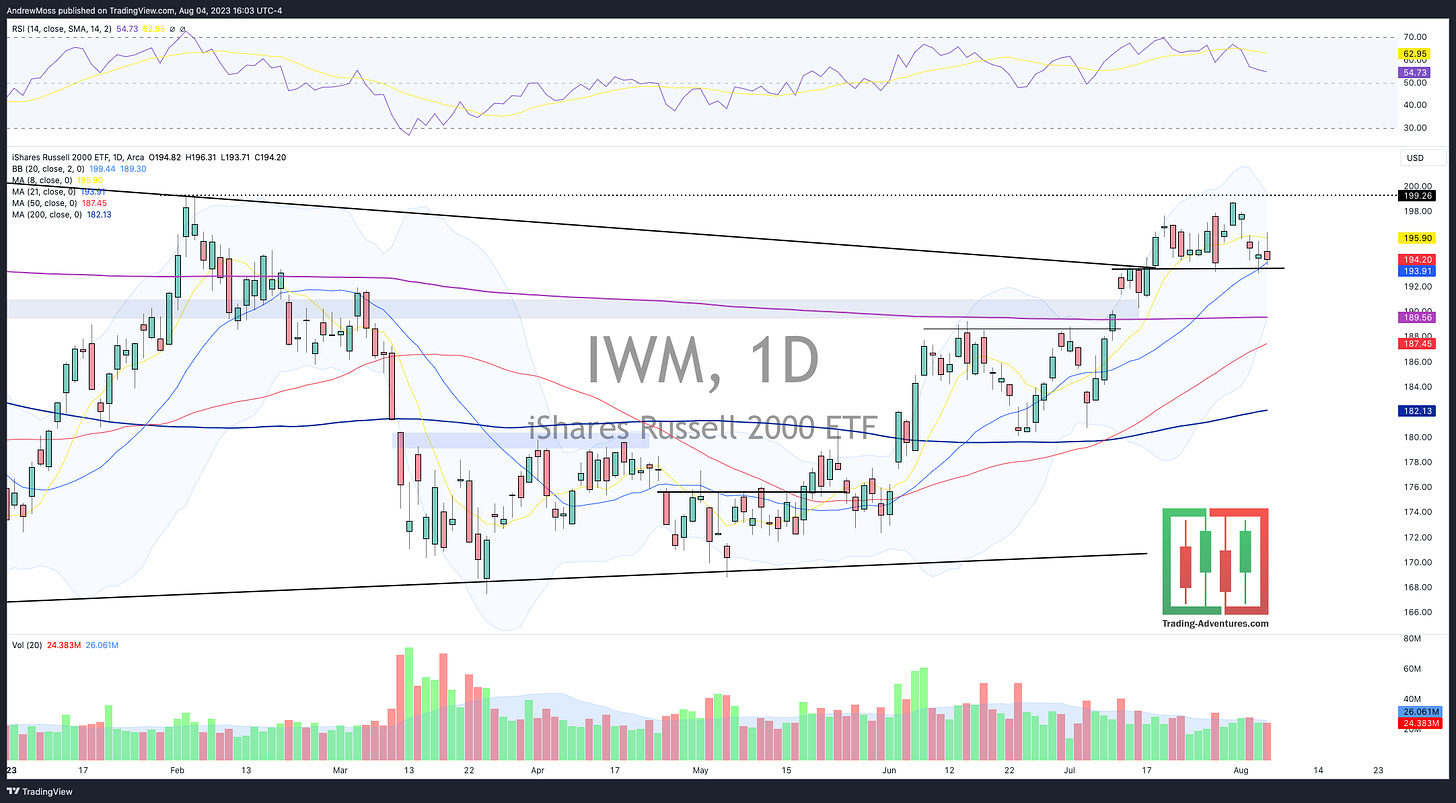
IWM IWM managed to close above the 21-day MA and recent support/resistance, demonstrating the relative strength that still exists with the small-caps.


DIA DIA is also still above the 21-day MA and had a very wide range today.

TLT TLT bounced providing some relief to yields (bonds up = yields down).

BTC BTC/USD Nothing to see here, yet.

DXY The declining Dollar worked in favor of stocks early in the day, but then the index bounced from its 8-day MA as stocks faltered.

VIX was also all over the place today dipping early and spiking late. Still worth watching.

Where do we go from here?
This pullback has been widely anticipated, even if the credit downgrade was not. Seasonal selling has arrived. So for now we continue to go a little slower and do a little less.
Subscribe to Trading Adventures and follow on Twitter/X for more charts and comments along the way.
The Disclosures
***This is NOT financial advice. NOT a recommendation to buy, sell, or trade any security. The content presented here is intended for educational purposes only.
Andrew Moss is an associated member of T3 Trading Group, LLC (“T3TG”) a SEC registered broker/dealer and member of FINRA/SIPC. All trades placed by Mr. Moss are done through T3TG.
Statements in this article represent the opinions of that person only and do not necessarily reflect the opinions of T3TG or any other person associated with T3TG.
It is possible that Mr. Moss may hold an investment position (or may be contemplating holding an investment position) that is inconsistent with the information provided or the opinion being expressed. This may reflect the financial or other circumstances of the individual or it may reflect some other consideration. Readers of this article should take this into account when evaluating the information provided or the opinions being expressed.
All investments are subject to the risk of loss, which you should consider in making any investment decisions. Readers of this article should consult with their financial advisors, attorneys, accountants, or other qualified investors prior to making any investment decision.
POSITION DISCLOSURE
August 4, 2023, 4:00 PM
Long: AMZN
Short:
Options symbols are denoted as follows:
Ticker, Date, Call/Put, Strike Price
Example: VXX1218C30 = VXX 12/18 Call with a $30 strike
Edge Rankings
Price Trend
© 2025 Benzinga.com. Benzinga does not provide investment advice. All rights reserved.
Trade confidently with insights and alerts from analyst ratings, free reports and breaking news that affects the stocks you care about.

