

- Expedia has been trading in a fairly consistent downtrend since April 18.
- If Expedia reacts bullishly to its earnings print, a new lower low may be created in the pattern.
- Get ahead of Wall Street reactions—Benzinga Pro delivers signals, squawk, and news fast. Now 60% off this 4th of July.
Expedia Group, Inc EXPE is set to print its first-quarter financial results after the market close. The stock was trading slightly lower heading into the event and remains down over 20% from the Feb. 16 all-time high of $217.72.
After the travel shopping company printed its fourth-quarter results on Feb. 10, volatility increased significantly and Expedia gapped up 5.8% higher the following day but closed that session down over 8% off the open. The dip was subsequently bought, because three trading days later Expedia reached its new all-time high.
For the fourth quarter, Expedia reported strong earnings, with an adjusted EPS of $1.06 compared to the analyst estimate of 67 cents.
For the first quarter, analysts, on average, expect Expedia to report a loss of 57 cents per share on revenues of $2.23 billion.
From a technical analysis standpoint, Expedia’s stock appears to have more downside ahead. It should be noted that holding stocks or options over an earnings print is akin to gambling because stocks can react bullishly to an earnings miss and bearishly to an earnings beat. Options traders, particularly those who are holding close dated calls or puts, take on extra risk because the intuitions writing the options increase premiums to account for implied volatility.
The implied move for options of Expedia expiring this week is 10.58%.
Want direct analysis? Find me in the BZ Pro lounge! Click here for a free trial.
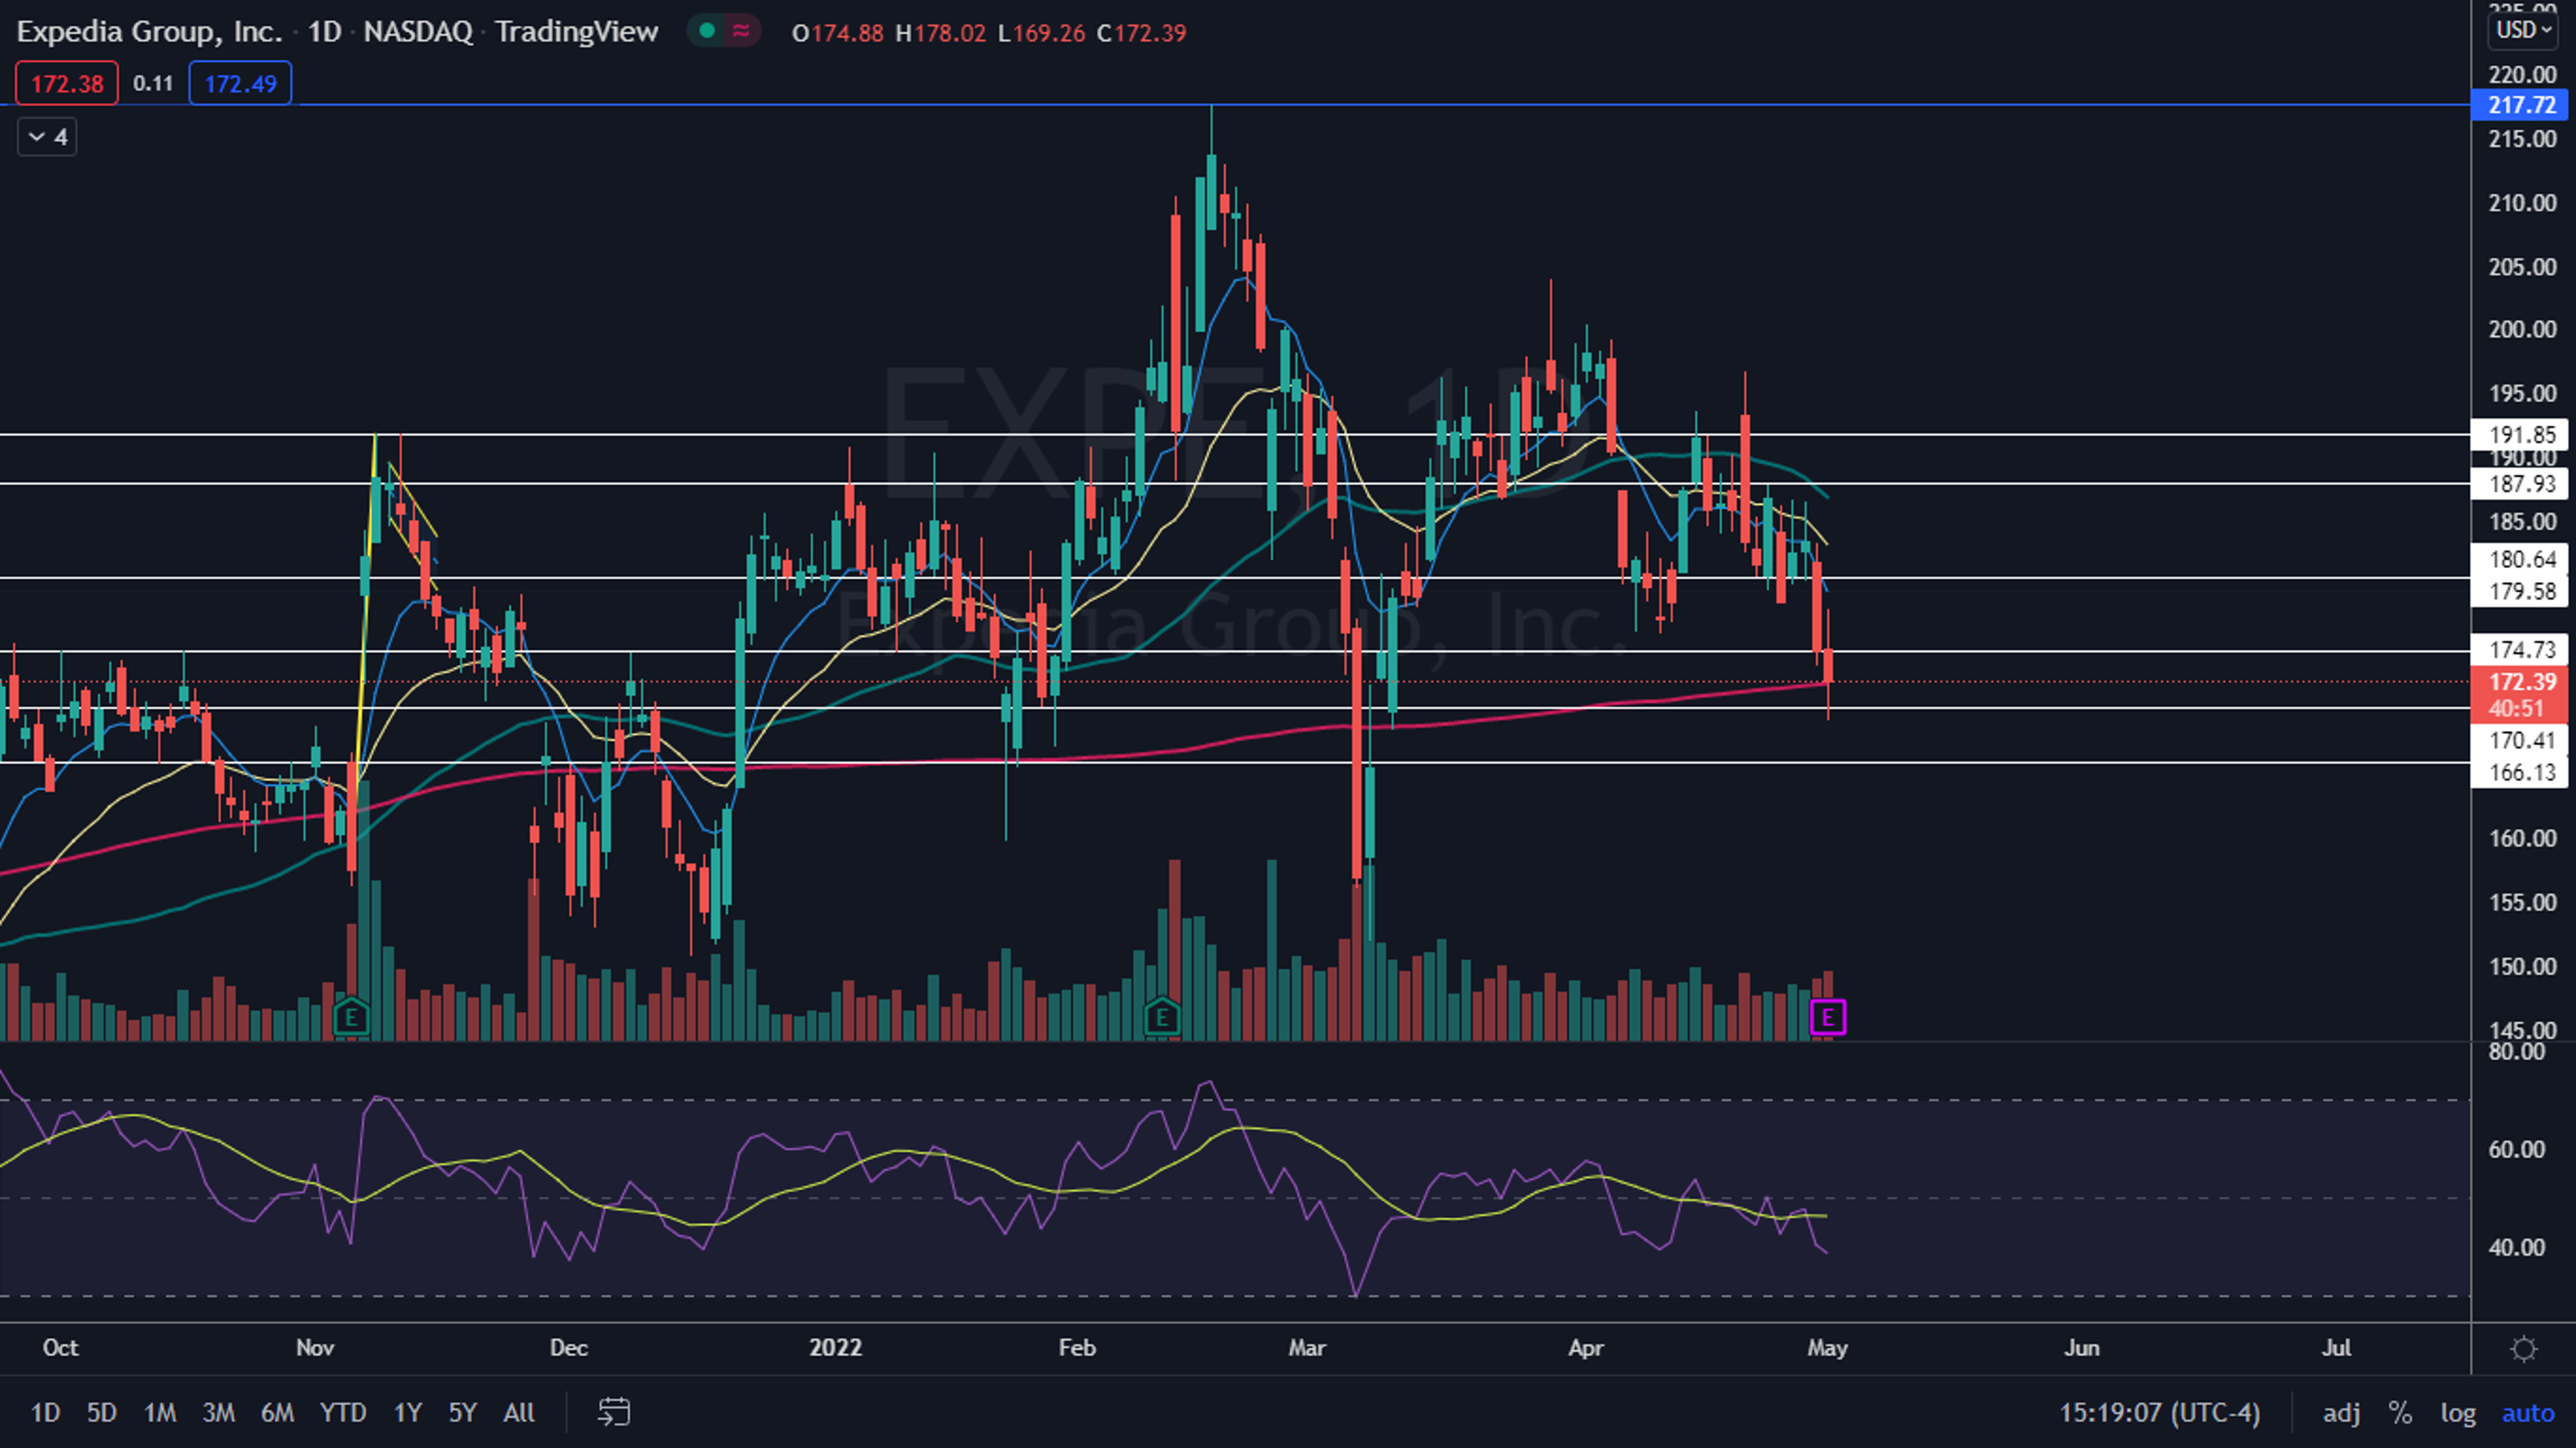
The Expedia Chart: Expedia fell over 3% lower at one point on Monday, dropping the stock below the 200-day simple moving average (SMA), which temporarily indicated Expedia may be entering into a bear cycle. By late afternoon, Expedia regained the area as support, and how the stock reacts to its earnings print is likely to be the determining factor as to whether the stock is able to remain trading above the 200-day SMA.
- Expedia has been trading in a fairly consistent downtrend since April 18, with the most recent lower high printed on April 27 at $186.62 and the most recent confirmed lower low formed at the $178.57 level the day prior. If Expedia reacts bullishly to its earnings print, Monday’s low-of-day may create the next lower low in the pattern.
- If Expedia closes the trading session above the 200-day SMA, it will print a doji or hammer candlestick, which could indicate higher prices are on the horizon for Tuesday. If the stock closes the trading session below that level, Expedia’s daily candle will have a long upper wick, which could indicate lower prices are on the way.
- The stock has resistance above at $174.73 and $179.58 and support below at $170.41 and $166.13.

See Also: How to Read Candlestick Charts for Beginners
Edge Rankings
Price Trend
© 2025 Benzinga.com. Benzinga does not provide investment advice. All rights reserved.
Trade confidently with insights and alerts from analyst ratings, free reports and breaking news that affects the stocks you care about.

