Benzinga

España
Italia
대한민국
日本
Français
Benzinga Edge
Benzinga Research
Benzinga Pro

  • Get Benzinga Pro
  • Data & APIs
  • Events
  • Premarket
  • Advertise
Contribute
España
Italia
대한민국
日本
Français

Benzinga

  • Premium Services
  • Financial News
    Latest
    Earnings
    Guidance
    Dividends
    M&A
    Buybacks
    Interviews
    Management
    Offerings
    IPOs
    Insider Trades
    Biotech/FDA
    Politics
    Healthcare
    Small-Cap
  • Markets
    Pre-Market
    After Hours
    Movers
    ETFs
    Options
    Cryptocurrency
    Commodities
    Bonds
    Futures
    Mining
    Real Estate
    Volatility
  • Ratings
    Analyst Color
    Downgrades
    Upgrades
    Initiations
    Price Target
  • Investing Ideas
    Trade Ideas
    Long Ideas
    Short Ideas
    Technicals
    Analyst Ratings
    Analyst Color
    Latest Rumors
    Whisper Index
    Stock of the Day
    Best Stocks & ETFs
    Best Penny Stocks
    Best S&P 500 ETFs
    Best Swing Trade Stocks
    Best Blue Chip Stocks
    Best High-Volume Penny Stocks
    Best Small Cap ETFs
    Best Stocks to Day Trade
    Best REITs
  • Money
    Investing
    Cryptocurrency
    Mortgage
    Insurance
    Yield
    Personal Finance
    Forex
    Startup Investing
    Real Estate Investing
    Prop Trading
    Credit Cards
    Stock Brokers
Research
My Stocks
Tools
Free Benzinga Pro Trial
Calendars
Analyst Ratings Calendar
Conference Call Calendar
Dividend Calendar
Earnings Calendar
Economic Calendar
FDA Calendar
Guidance Calendar
IPO Calendar
M&A Calendar
Unusual Options Activity Calendar
SPAC Calendar
Stock Split Calendar
Trade Ideas
Stock Reports
Insider Trades
Trade Idea Feed
Analyst Ratings
Unusual Options Activity
Heatmaps
Free Newsletter
Government Trades
Perfect Stock Portfolio
Easy Income Portfolio
Short Interest
Most Shorted
Largest Increase
Largest Decrease
Calculators
Margin Calculator
Forex Profit Calculator
100x Options Profit Calculator
Screeners
Stock Screener
Top Momentum Stocks
Top Quality Stocks
Top Value Stocks
Top Growth Stocks
Compare Best Stocks
Best Momentum Stocks
Best Quality Stocks
Best Value Stocks
Best Growth Stocks
Connect With Us
facebookinstagramlinkedintwitteryoutubeblueskymastodon
About Benzinga
  • About Us
  • Careers
  • Advertise
  • Contact Us
Market Resources
  • Advanced Stock Screener Tools
  • Options Trading Chain Analysis
  • Comprehensive Earnings Calendar
  • Dividend Investor Calendar and Alerts
  • Economic Calendar and Market Events
  • IPO Calendar and New Listings
  • Market Outlook and Analysis
  • Wall Street Analyst Ratings and Targets
Trading Tools & Education
  • Benzinga Pro Trading Platform
  • Options Trading Strategies and News
  • Stock Market Trading Ideas and Analysis
  • Technical Analysis Charts and Indicators
  • Fundamental Analysis and Valuation
  • Day Trading Guides and Strategies
  • Live Investor Events
  • Pre-market Stock Analysis and News
  • Cryptocurrency Market Analysis and News
Ring the Bell

A newsletter built for market enthusiasts by market enthusiasts. Top stories, top movers, and trade ideas delivered to your inbox every weekday before and after the market closes.

  • Terms & Conditions
  • Do Not Sell My Personal Data/Privacy Policy
  • Disclaimer
  • Service Status
  • Sitemap
© 2026 Benzinga | All Rights Reserved
March 16, 2022 9:40 AM 4 min read

Can AMC Entertainment, Coinbase And Roblox Stocks Buck This Trend? Here's How To Play The Pattern

by Melanie Schaffer Benzinga Editor
Follow
FlipboardIcon version of the Flipboard logo

AMC Entertainment Holdings, Inc (NYSE:AMC), Coinbase Global, Inc (NASDAQ:COIN) and Roblox Corporation (NYSE:RBLX) are all trading higher in strong downtrends. A downtrend occurs when a stock consistently makes a series of lower lows and lower highs on the chart.

The lower lows indicate the bears are in control, while the intermittent lower highs indicate consolidation periods. Traders can use moving averages to help identify a downtrend, with descending lower timeframe moving averages (such as the eight-day or 21-day exponential moving averages) indicating the stock is in a steep shorter-term downtrend and descending longer-term moving averages (such as the 200-day simple moving average) indicating a long-term downtrend.

A stock often signals when the lower low has been established by printing a reversal candlestick such as a doji, bullish engulfing or hammer candlestick. Likewise, the lower high could be signaled when a doji, gravestone or dragonfly candlestick is printed. Moreover, the lower lows and lower highs frequently take place at resistance and support levels.

In a downtrend the "trend is your friend" until it’s not and in a downtrend, there are ways for both bullish and bearish traders to participate in the stock:

  • Bearish traders who are already holding a position in a stock can feel confident the downtrend will continue unless the stock makes a higher high. Traders looking to take a position in a stock trading in a downtrend can usually find the safest entry on the lower high.

Bullish traders can enter the trade on the lower low and exit on the lower high. These traders can also enter when the downtrend breaks and the stock makes a higher high indicating a reversal into an uptrend may be in the cards.

See Also: AMC 'Playing On Offense Again,' Picks Up 22% Stake In Gold And Silver Miner Hycroft: What Investors Should Know

The AMC Chart: AMC began trading in a downtrend on Feb. 10 and has since made a consistent series of lower highs and lower lows. The most recent lower high was printed on March 9 at $16.27 and the most recent lower low was formed at the $12.90 mark on Monday. To negate the downtrend, big bullish volume will need to come in and drive AMC up above the March 9 high-of-day, or for AMC to print a higher low above the $12.90 level.

  • AMC has developed bullish divergence on the daily chart, which indicates a larger bounce to the upside may come.
  • Bullish traders would feel more confident if the stock was able to regain the eight-day exponential moving average as support.
  • AMC has resistance above at $14.96 and $17.07 and support below at $12.22 and $9.90.

Want direct analysis? Find me in the BZ Pro lounge! Click here for a free trial.

The Coinbase Chart: Coinbase has been trading in a fairly consistent downtrend since Nov. 9 but the most recent consistent downtrend began on Feb.9. The stock’s most recent lower high was formed at on March 9 and $181.45 and the most recent lower low was created at the $150.12 mark on Tuesday.

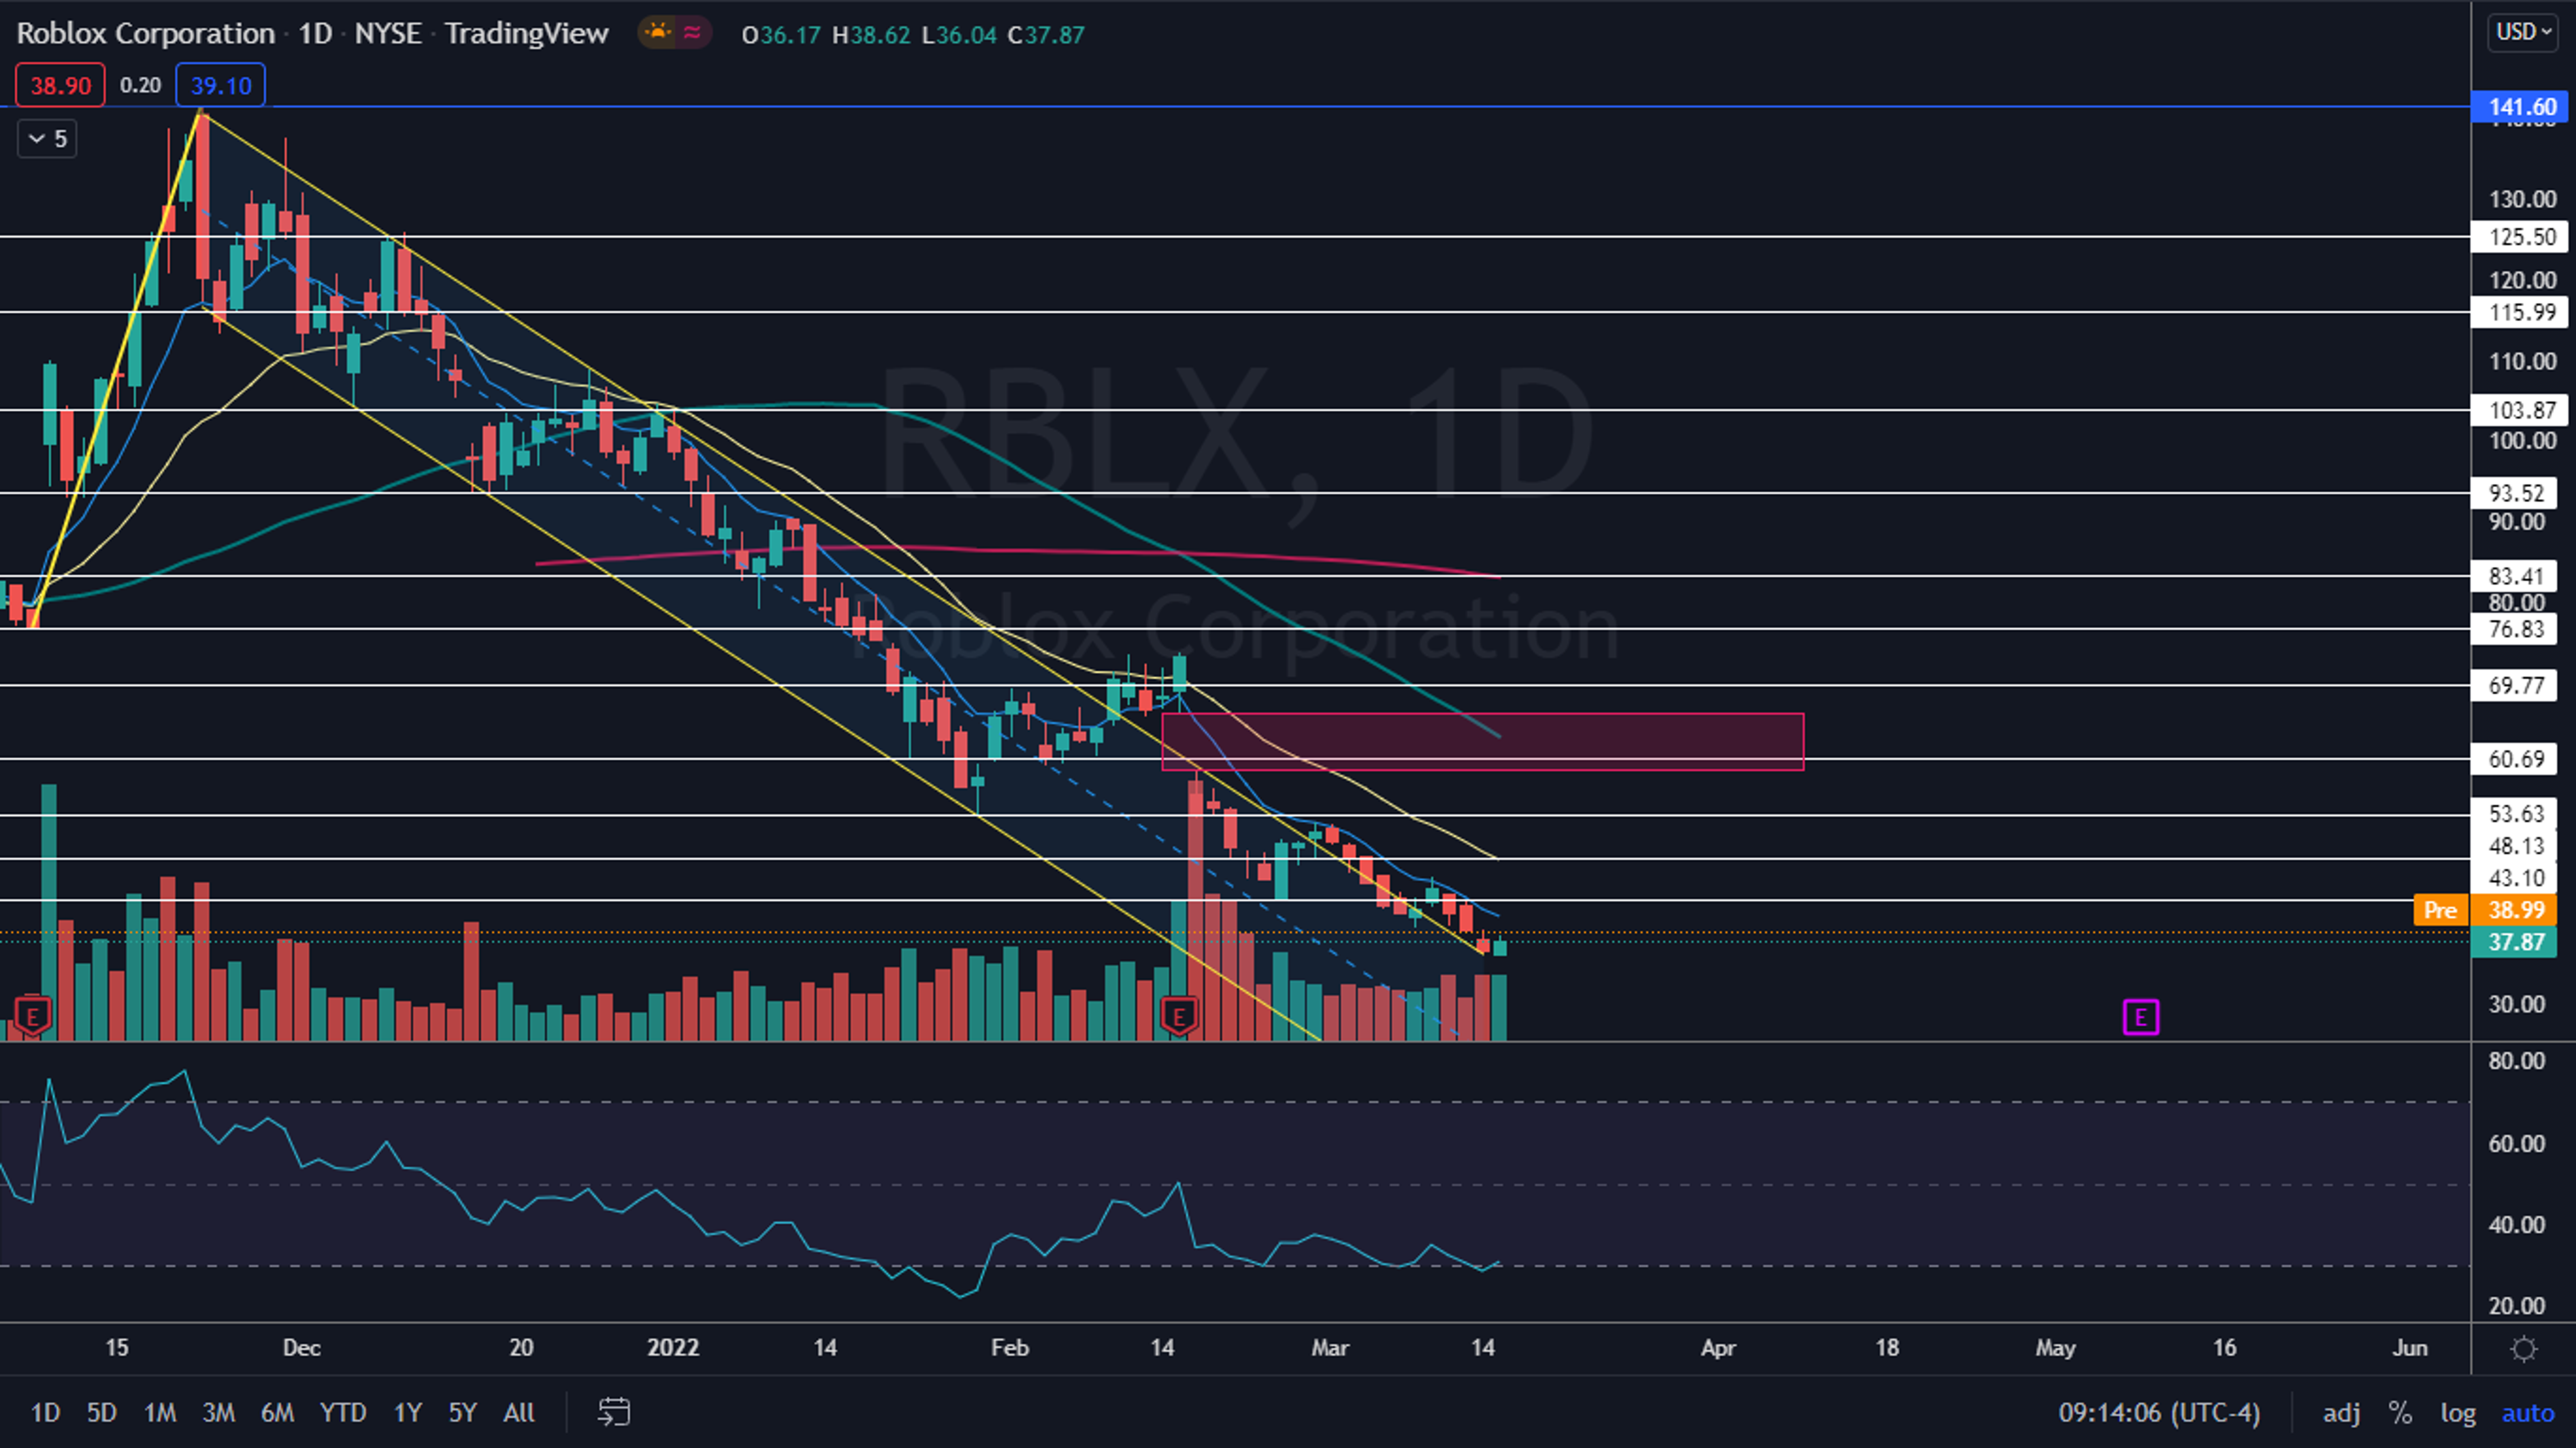
The Roblox Chart: Roblox has been trading in a steep downtrend since Nov. 22, losing 72% of its value to trade at an all-time low of $36.04. The most recent lower high was printed on March 9 at $45.75 and the most recent lower low was created at the all-time low on Tuesday.

  • Roblox’s relative strength index has been hovering near the 30% level since Feb.16, which indicates a larger bounce will likely come at some point in the future because the stock is technically oversold.
  • Like Coinbase, Roblox has a gap above between $59 and $66.34.
  • Roblox has resistance above at $43.10 and $48.13 and support below at the all-time low.

See Also: Here's Why Roblox's February Metrices Disappointed Benchmark

Market News and Data brought to you by Benzinga APIs

© 2026 Benzinga.com. Benzinga does not provide investment advice. All rights reserved.

To add Benzinga News as your preferred source on Google, click here.


Posted In:
TechnicalsMoversTrading Ideas
AMC Logo
AMCAMC Entertainment Holdings Inc
$1.10-1.79%
Overview
COIN Logo
COINCoinbase Global Inc
$195.76-1.44%
RBLX Logo
RBLXRoblox Corp
$59.82-0.94%
  • On Tuesday, Coinbase printed a hammer candlestick on the daily chart, which indicates higher prices may come on Wednesday. The stock will need to rise up above the March 9 high-of-day to negate the downtrend.
  • Coinbase has a gap above on the chart between $217.49 and $220.84, which is about 90% likely to fill at some point in the future.
  • The stock has resistance above at $162.20 and $177.45 and support below at Tuesday’s all-time low near the $150 mark.
AMC Logo
AMCAMC Entertainment Holdings Inc
$1.10-1.79%
Overview
COIN Logo
COINCoinbase Global Inc
$195.76-1.44%
RBLX Logo
RBLXRoblox Corp
$59.82-0.94%
Comments
Loading...