
Amazon.com, Inc (NASDAQ:AMZN) gapped down 5.89% on Thursday and slid an additional 1.3% intraday after Meta Platforms, Inc (NASDAQ:FB) spooked the market with a fourth-quarter earnings miss and plummeted over 20%.
Amazon will be the last of the big FAANG stocks to print its earnings when it reports after the bell on Thursday and traders and investors may be worried a bearish reaction to the tech giant’s results could throw not only Amazon but the general markets into turmoil.
Analysts expect Amazon to report quarterly earnings at $3.67 per share on revenue of $137.60 billion. For the third quarter, analysts estimated Amazon would report EPS of $8.92 on revenue of $111.6 billion and on Oct. 28 the company reported a miss, with earnings per share of $6.12 on revenue of $110.8. The stock gapped down 4.25% the following day but ran over 14% higher over the two weeks that followed to reach a Nov. 19 high of $3,762.15.
Amazon’s chart is set to go either way because the stock is signaling both bearish and bullish indicators. Traders not already in a position may prefer to wait and see how the stock reacts on Friday because earnings can create both volatile and irrational share price swings following the print.
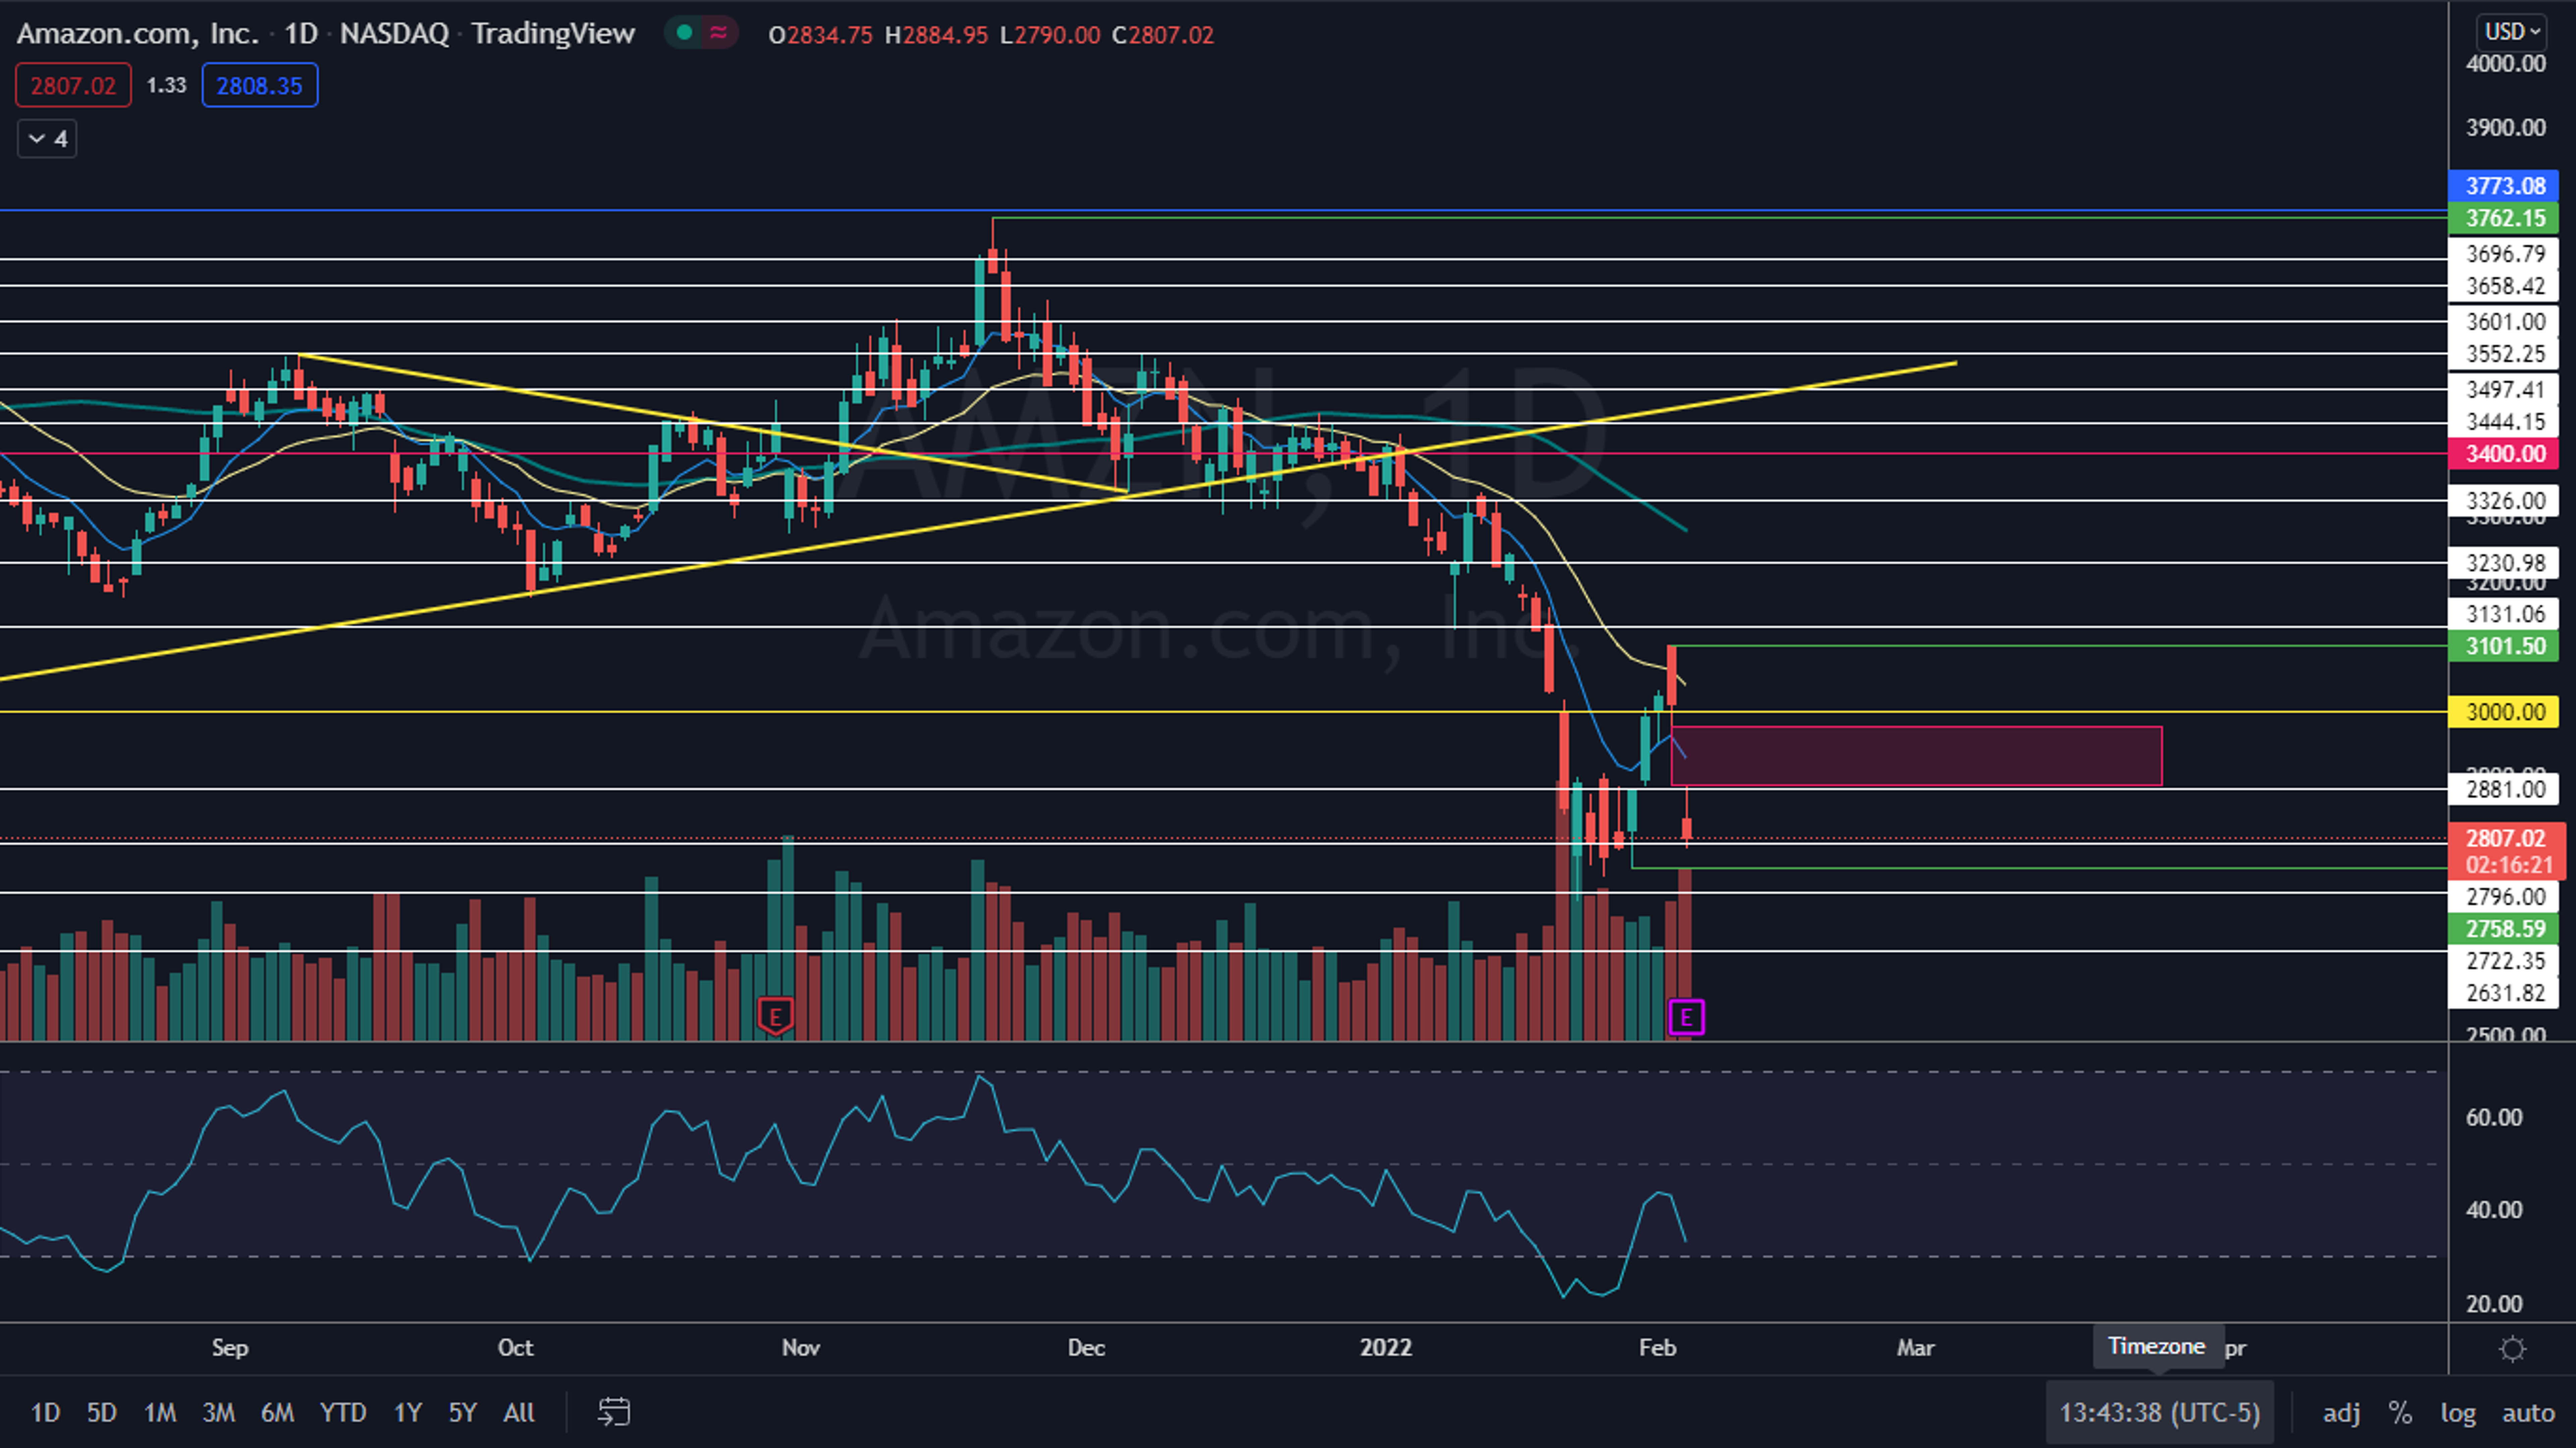
The Amazon Chart: Amazon is trading in a confirmed uptrend on the daily chart with the most recent higher high printed on Thursday at the $3,101.50 level and the most recent higher low created on Jan. 28 at $2,758.59. When Amazon fell lower on Thursday, the stock didn’t negate the trend and may just be printing its next higher low.
The move lower caused Amazon to lose support at the psychologically important $3,000 level, however, which leans bearish because that will now likely act as heavy resistance. If Amazon has a bullish reaction to its earnings print, bulls will want to see Amazon open above the level or fly through it first thing Friday morning.
Amazon now has a gap above on the chart between the $2,884.95 and $2,977.27 range. Gaps on charts fill about 90% of the time, which makes it likely Amazon will trade back up into the area in the future.
Want direct analysis? Find me in the BZ Pro lounge! Click here for a free trial.
Amazon will most likely print either a bullish inverted hammer candlestick, a bullish hammer candlestick or a doji, which indicates indecision. Although technical traders can watch to see what type of candlestick Amazon prints when the trading session closes, it's a lagging indicator.
If Amazon sells off following its earnings print, it's likely to at least bounce up over the coming trading days because a lower share price will drop the stock’s relative strength index (RSI) below the 30% level. When a stock’s RSI reaches or falls below the 30% level it becomes oversold, which can be a buy signal for technical traders.
Amazon has resistance above at $2,881 and $3,000 and support below at $2,796 and $2,722.35.

© 2025 Benzinga.com. Benzinga does not provide investment advice. All rights reserved.