
Ford Motor, Inc F gapped down slightly lower on Friday in sympathy with the SPDR S&P 500 SPY, which was trading down about 0.55%.
On Wednesday, Ford CEO Jim Farley met President Joe Biden at the White House, along with other industry leaders, to discuss “the importance of strong consumer EV incentives,” Farley said on Twitter.
The incentives could be enacted as part of Biden’s signature $1.75-trillion Build Back Better legislation.
Biden has vowed to make 50% of all vehicles in the U.S. "zero-emissions" by 2030, and since Farley became CEO in October 2020, he ramped up the legacy automaker’s efforts to switch to EVs.
Despite the huge amount of growth Ford is likely to go through over the next few years as it becomes a major competitor in the EV sector, the stock is still affected by the general market, and when the SPY printed its first lower high, which confirmed a downtrend on Jan. 13, it marked the top for Ford.
See Also: Truck Tech: Wish You Were Here Edition
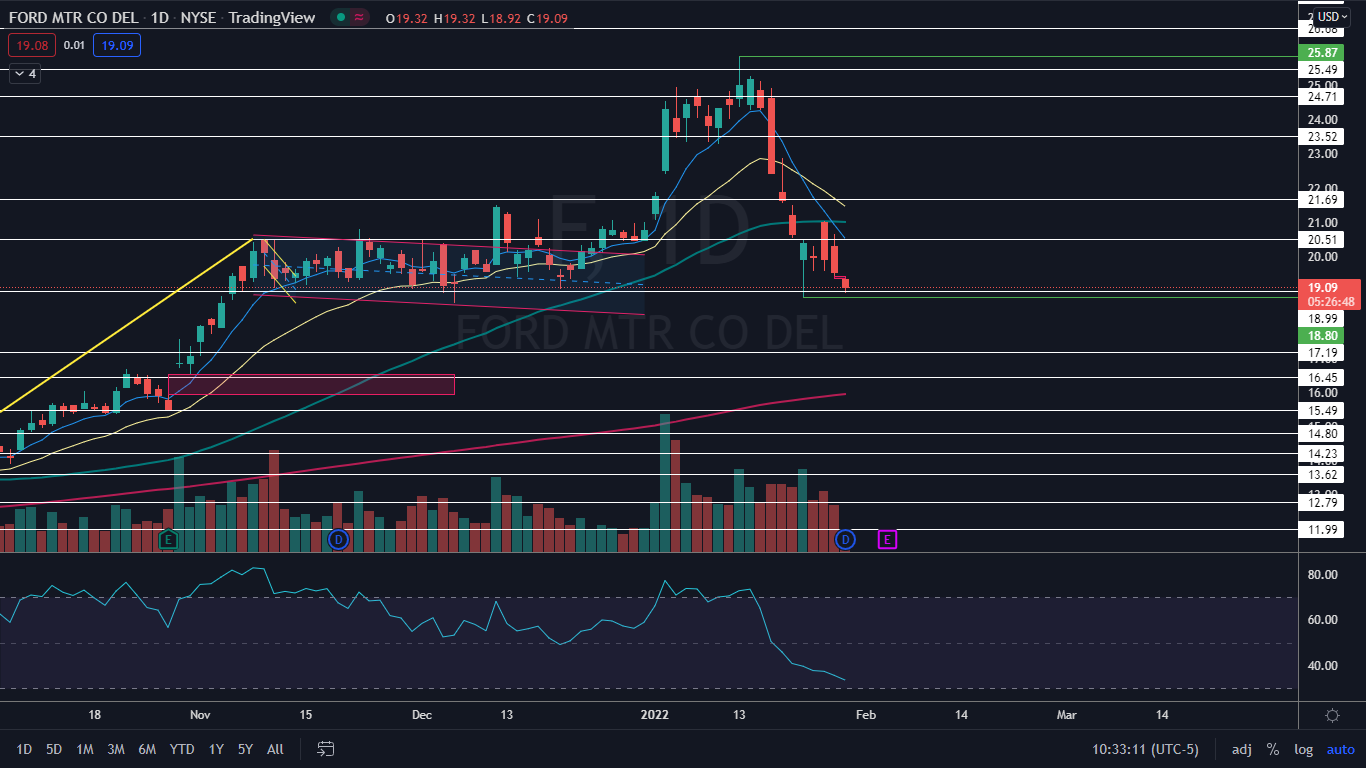
The Ford Chart: On Jan. 13, Ford hit a high of $25.87 and then fell 27% over the six trading days that followed. On Jan. 25 and Jan. 26, the stock bounced up slightly toward the $21 level, where it hit resistance at the 50-day simple moving average (SMA), which caused Ford to print a lower high and confirm it is now trading in a downtrend.
On Friday, Ford did not make a lower low under the Jan. 24 low of $18.80. The most likely scenario is that either Ford will make another lower low over the coming trading days or that the stock will trade sideways into a horizontal or tightening pattern to consolidate the quick drop lower over the last nine trading days.
It should be noted that Ford is set to report its third-quarter earnings on Feb. 3 after the closing bell. Traders and investors who are not already in a position may want to wait and gauge the reaction from the earnings print before purchasing shares.
The $19 dollar level is key on Ford's stock because it has not closed a trading day below the level since Nov. 3.
Ford is trading below the eight-day and 21-day exponential moving averages (EMAs), with the eight-day EMA trending below the 21-day, both of which are bearish indicators. The stock is trading above the 200-day simple moving average, however, which indicates Ford is in a bull cycle.
Want direct analysis? Find me in the BZ Pro lounge! Click here for a free trial.
- Bullish traders want to see continued sideways consolidation and then for big bullish volume to come in following the earnings print to push the stock up above the 50-day SMA. There is resistance above at $20.51 and $21.69.
- Bears want to see big bearish volume come in and drop Ford down to make a lower low, which will confirm the downtrend is still intact. There is support below at $18.99 and $17.19.
© 2024 Benzinga.com. Benzinga does not provide investment advice. All rights reserved.
Comments
Trade confidently with insights and alerts from analyst ratings, free reports and breaking news that affects the stocks you care about.

