


AMC Entertainment Holdings, Inc AMC and GameStop Corporation GME have both been trading in bearish downtrends since Nov. 23, making consistent lower highs and lower lows.
On Monday, AMC and GameStop plummeted about 15% and 16%, respectively, and on Tuesday both stocks were attempting to erase some of their losses. The two retail favorites were due for a bounce because their relative strength indexes (RSIs) were measuring into oversold territory near the 30% level, which Benzinga predicted in reference to AMC’s stock on Monday.
AMC and GameStop both have a lot of work to do to buck their downtrends, however, but it should be noted that events affecting the direction of the general markets, positive or negative reactions to earnings prints and news headlines about a stock can quickly invalidate patterns.
As the saying goes, "the trend is your friend until it isn't," and any trader in a bullish or bearish position should have a clear stop set in place and manage their risk versus reward.
AMC and GameStop have embraced the non-fungible token (NFT) space as it continues to go mainstream, with GameStop in the process of building an NFT platform on the Ethereum ETH/USD network. AMC CEO Adam Aron has gone a different route by giving away free NFTs to shareholders who enroll in the company’s Investor Connect program.
Want direct analysis? Find me in the BZ Pro lounge! Click here for a free trial.
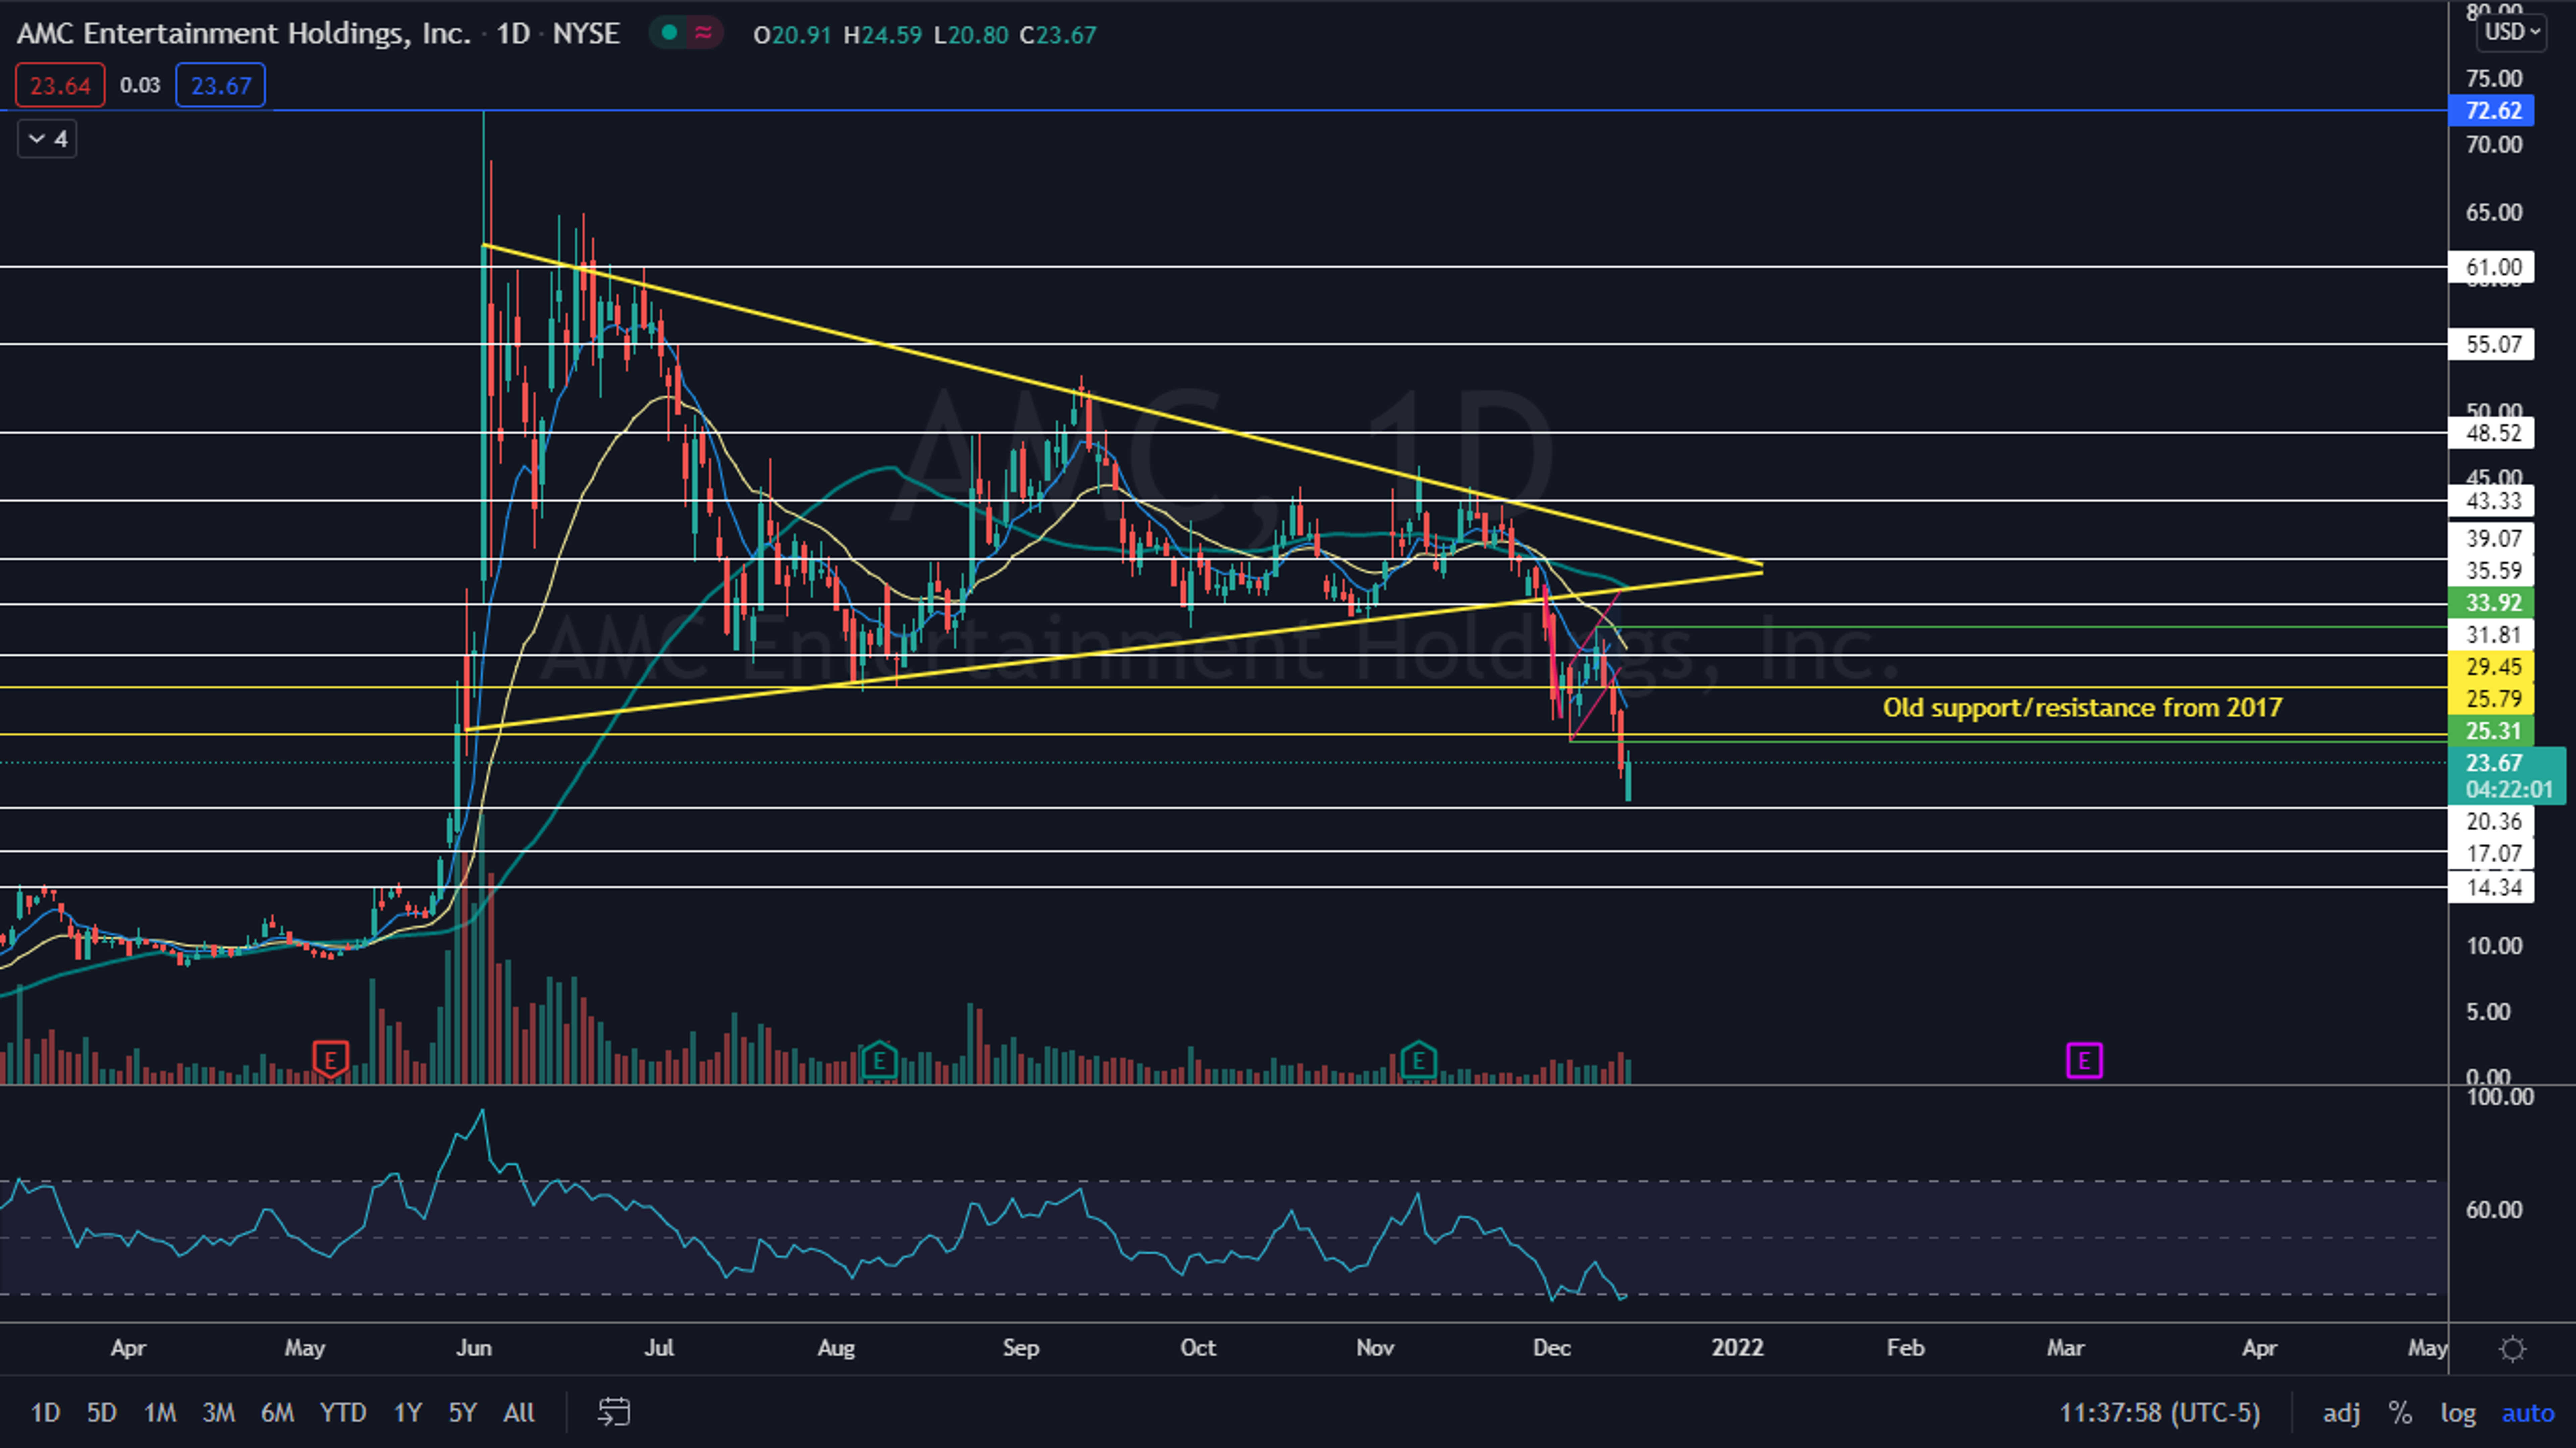
The AMC Chart: AMC broke bearishly down from a bull flag pattern on Dec. 9 and has since plummeted about 20%.
- The stock’s most recent lower high was printed on Dec. 8 at the $33.92 level and AMC’s most recent lower low was created on Tuesday at the $20.80 low-of-day.
- AMC will need to eventually print a higher low to continue in the downtrend unless it can climb up over the Dec. 8 high-of-day and reverse into an uptrend.
- Traders can watch for an inside bar to develop on Wednesday as the stock consolidates the recent volatility, and a break of the inside bar will allow traders to gauge the stock’s next immediate direction.
- AMC has heavy resistance above at $25.79 and $29.45 and support below at $20.36 and $17.07.

The GameStop Chart: GameStop has been trading in a downtrend within a descending channel since Nov. 24.
- The top descending trendline of the pattern is likely to act as resistance and the lower trendline as support.
- If GameStop is able to push up above the top trendline of the pattern, it could run higher as it did on three previous occasions after trading in a descending channel.
- GameStop’s most recent lower high was printed on Dec. 7 at the $181.98 mark and the most recent lower low at the $129.50 mark on Tuesday.
- The stock has resistance above at $145.22 and $166.70 and support below at $118.62 and $91.50.
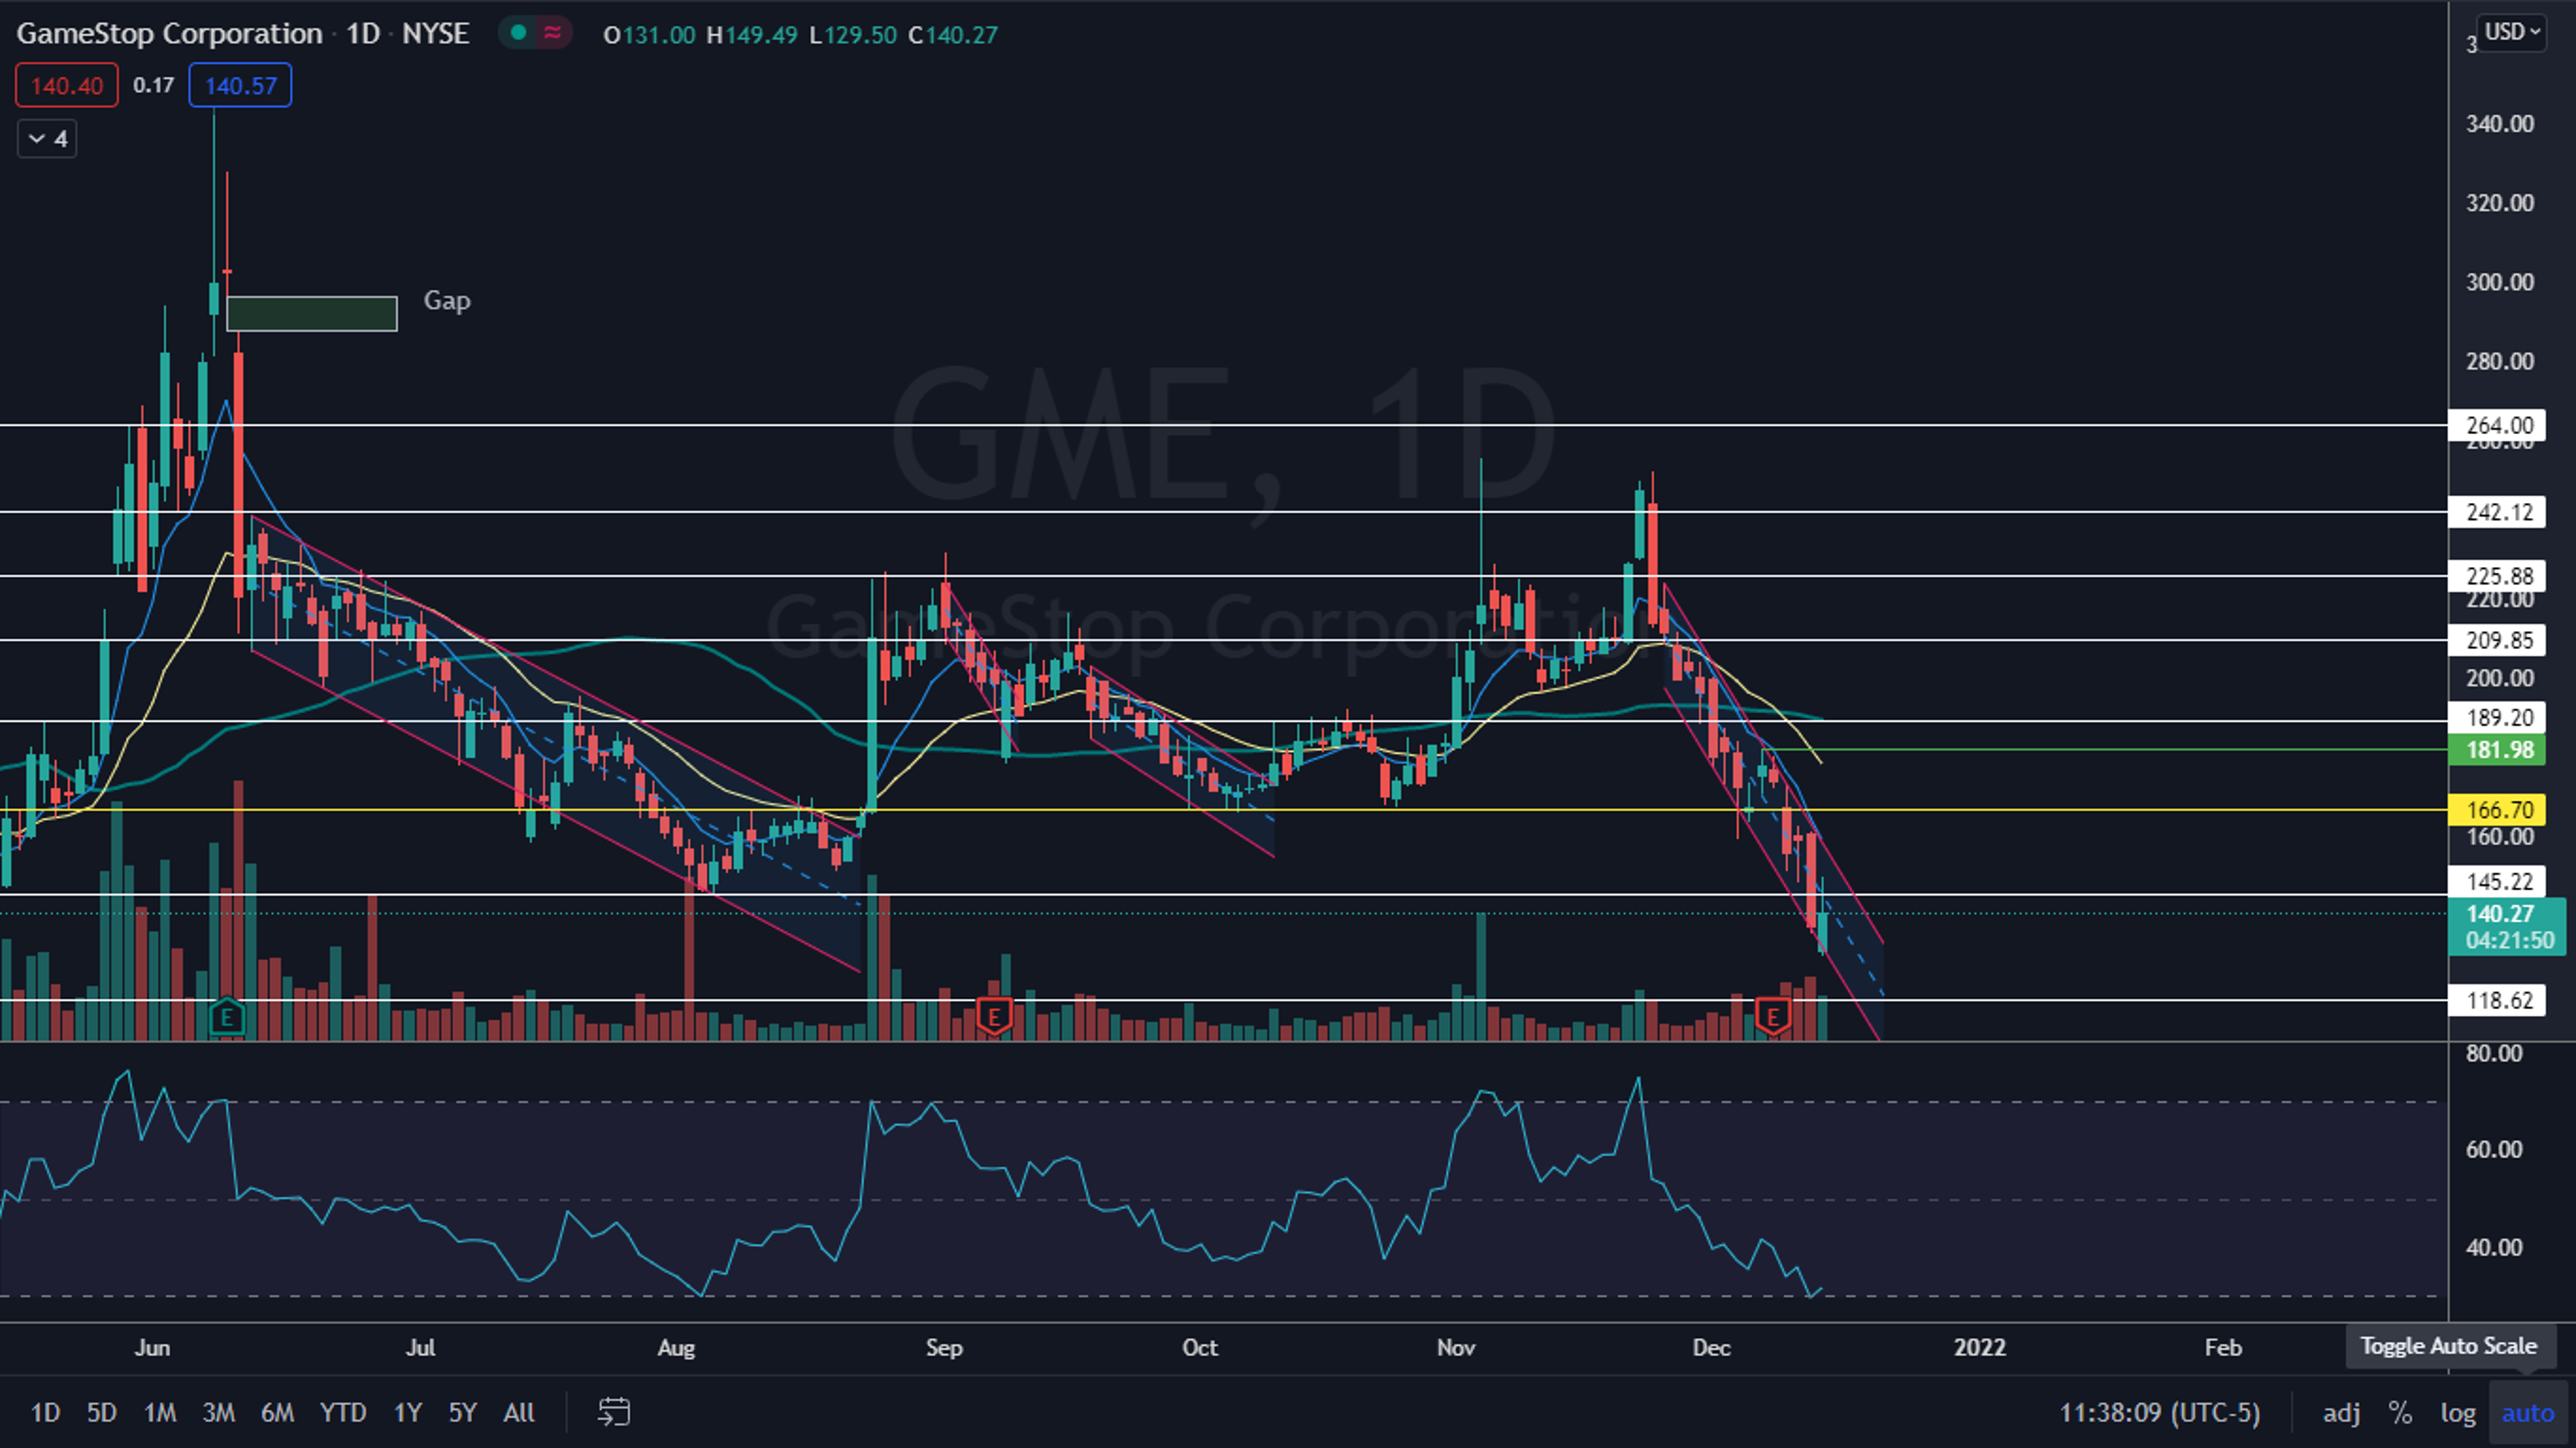
Photo: Sergei Tokmakov from Pixabay.
Edge Rankings
Price Trend
© 2025 Benzinga.com. Benzinga does not provide investment advice. All rights reserved.
Trade confidently with insights and alerts from analyst ratings, free reports and breaking news that affects the stocks you care about.

