This article was originally published on Lightspeed last week. More analysis to come in webinars on April 28 and May 4.
After Amazon.com, Inc AMZN finished 2015 as the second largest gainer in the entire S&P 500, the stock started off 2016 with some heavy selling pressure that dropped it from its all-time high of $696.44 in late December to $474.00 by mid-February. That 30 percent drop was certainly scary for Amazon shareholders, but the stock has since rebounded and is once again threatening to regain the $600 level.
In the past couple of days, Amazon’s chart has formed one of the most notoriously bearish technical analysis formations in the trading world. But things are not always be as they seem.
THE CROSS
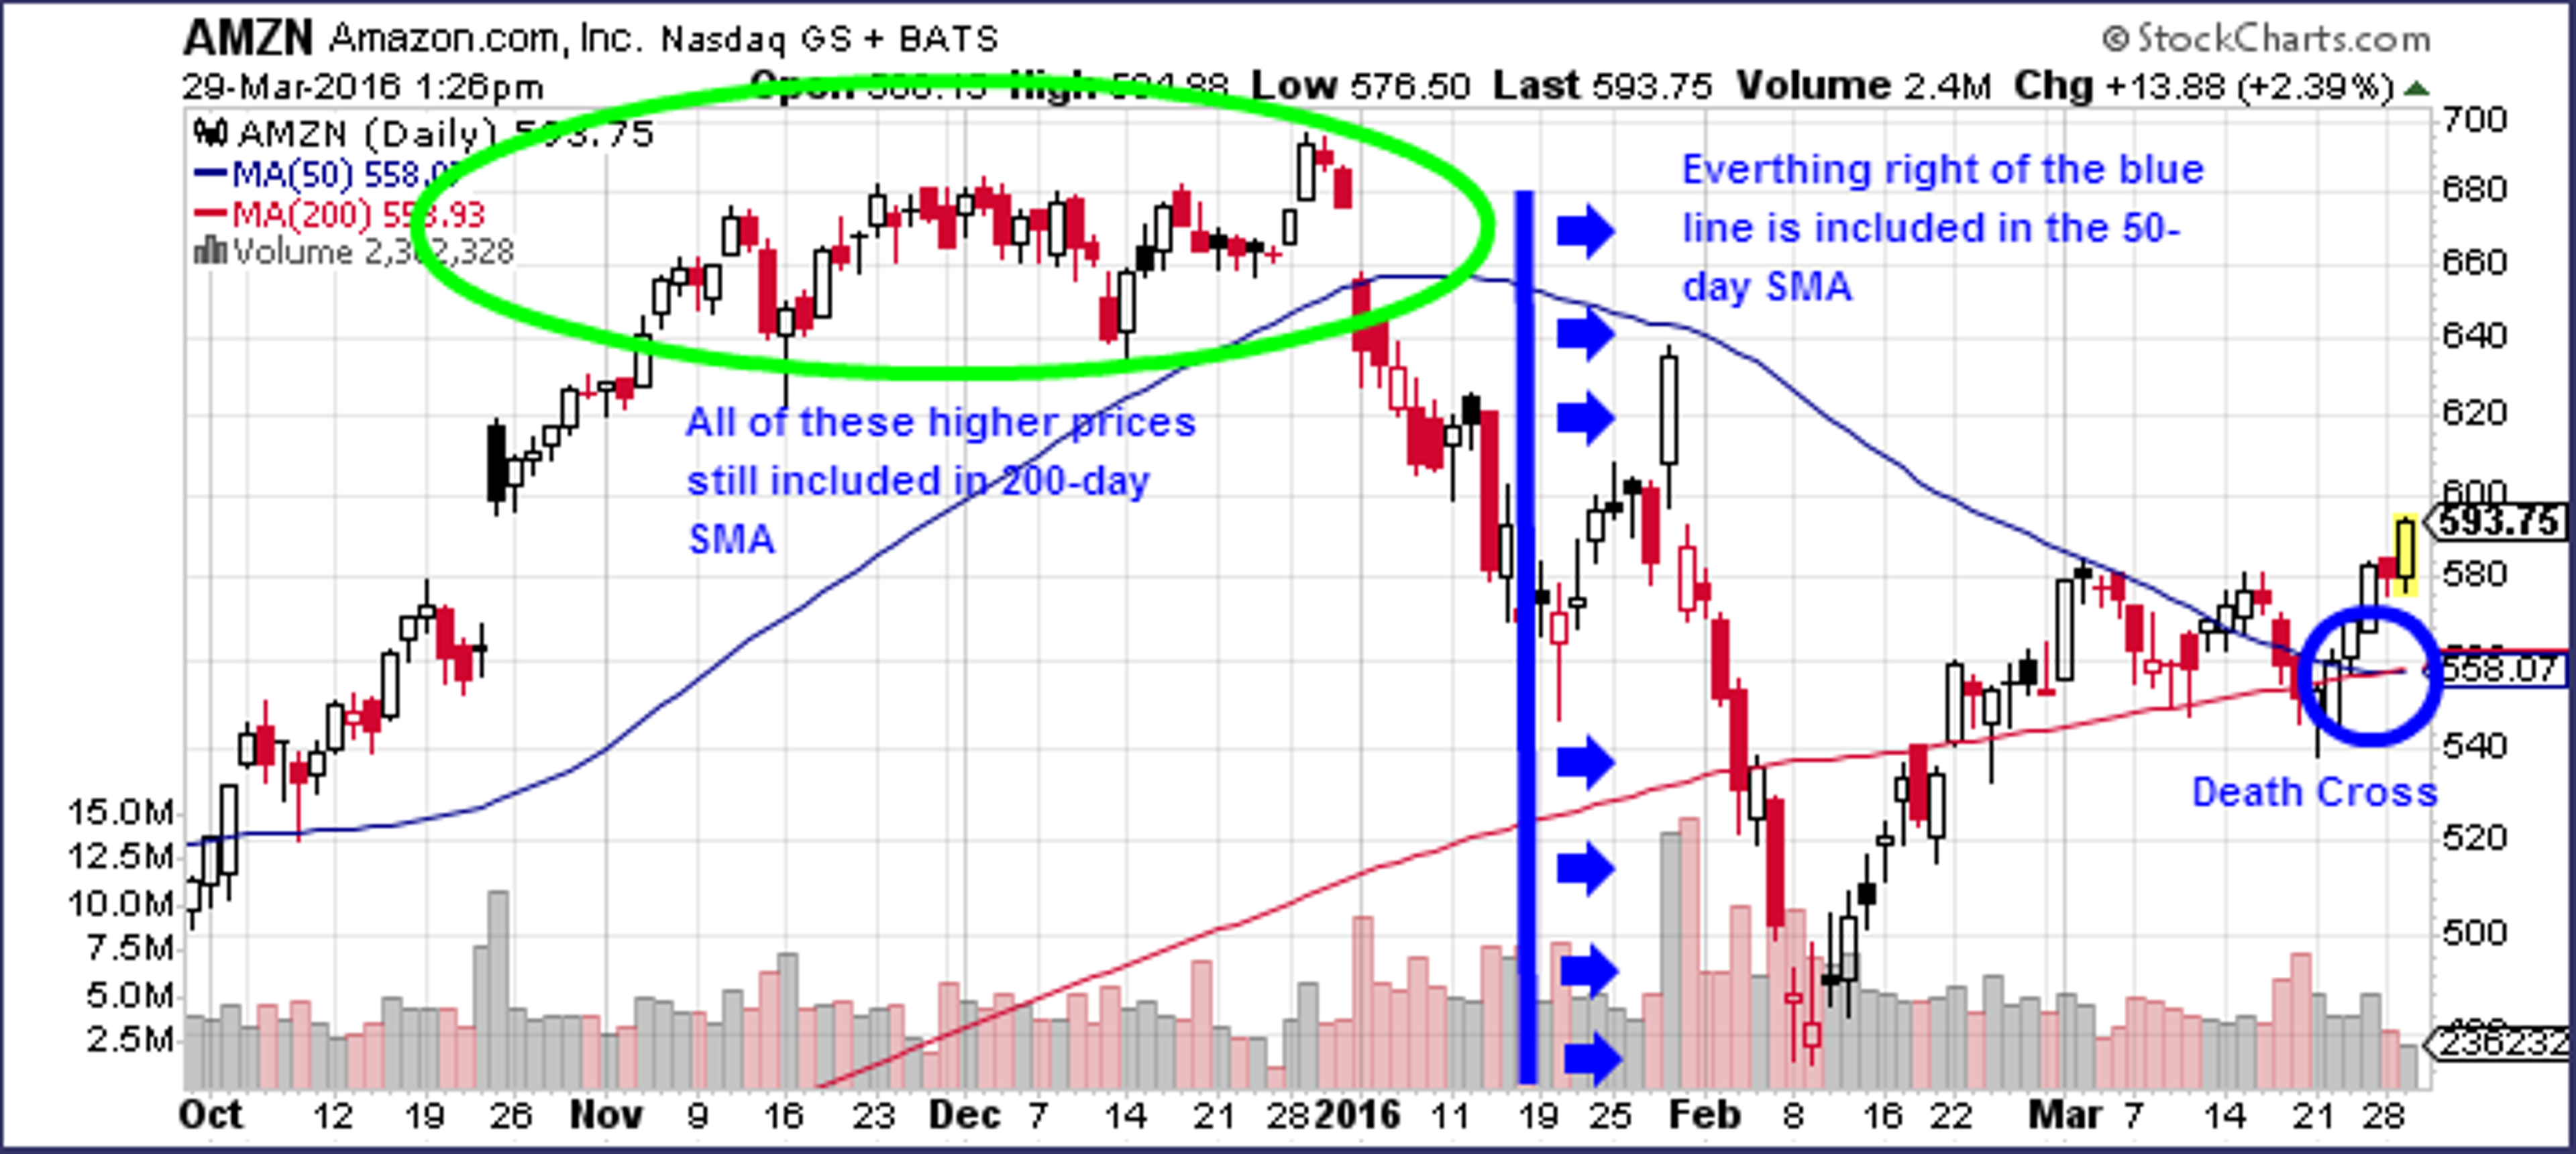
Amazon recently endured one of the classic bearish technical formations: the Death Cross. A Death Cross occurs when the shorter-term 50-day simple moving average (SMA) crosses below the longer-term 200-day SMA and is usually a sign that a stock has negative short-term momentum. However, in Amazon’s case, the Death Cross is far from typical.
In Amazon’s case, the Death Cross is more an indicator of past weakness than current weakness. Amazon’s 50-day SMA took a hard dive during the steep January and February sell-off, and the worst of the dip is still being included in the calculation of the 50-day SMA at this point. That means that even if Amazon trades sideways in coming weeks, its 50-day SMA will begin to rise, likely rendering the Death Cross very short-lived.

RESISTANCE
Instead of worrying about the Death Cross, Amazon traders should be turning their attention to support and resistance levels. After consolidating between $585 and $538 for several weeks, Amazon recently broke out to its highest level since January. Now that the $585 resistance is out of the way, the January spike to $638 could be the next level of resistance. If Amazon moves above $638, expect a re-test of all-time highs of $696 in coming months.


SUPPORT
Now that $585 resistance has been broken, the level could serve as short-term support. If Amazon breaks down below that level, look to $558 for support. This is the level at which the stock’s 50-day and 200-day SMAs currently rest. Below that, Amazon’s 2016 low of $474 needs to hold to keep Amazon’s chart from looking extremely bearish in months to come.
TAKEAWAY
It’s never a good idea to rely on one single metric or chart formation, such as the Death Cross, to blindly make trading decisions. Trading rules become rules over time because they work the majority of the time, but there are always plenty of exceptions. Amazon’s chart isn’t particularly bullish at the moment, but its recent Death Cross isn’t something that traders need to be worried about.
Disclosure: the author has no position in the stocks mentioned.
© 2024 Benzinga.com. Benzinga does not provide investment advice. All rights reserved.
Trade confidently with insights and alerts from analyst ratings, free reports and breaking news that affects the stocks you care about.

