


Loading...
Loading...
There's no question that technical analysis is tricky. Learning how to take a stock chart and make a profit producing prediction takes years of study and experience. But with decades of technicals under our belt, we're here today to show you why there's only one long-side pattern you need to know to profit from this market.
It's time to dissect the Pullback Off Highs...
The Pullback Off Highs pattern is one of the most bullish and constructive long-side set-ups out there. Rather than moving straight up, an index or stock will make a move higher, then spend some time consolidating those gains often down to an area of chart support such as its 50-day moving average, before making another move into new high ground.
When a stock clears these consolidation periods, it's your opportunity to buy them and take advantage of the next run. The bonus part is that when you catch a stock at the beginning of a new uptrend, you'll often get to trade the stock and lock in profits over and over again. That's because buying it at the point where it's just started a new move and is near support, which minimizes your risk. Here's a current example:

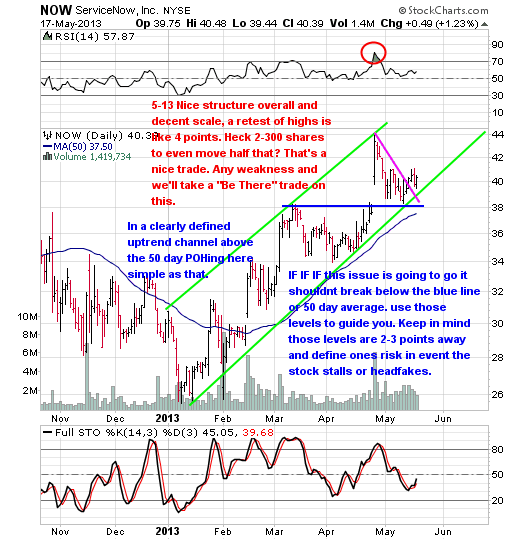
In the chart above are 3 things you ALWAYS want to be on the lookout for:
1. Defined Uptrend
The stock should be in a clearly defined uptrend and above the 50-day moving average, the green trend channel above shows that.
2. Pull Back to Trendline Support
We always want to see a stock that's sitting right above trendline support as well (thick green line). Stocks bounce off their trendlines, so we want to take our position just before a stock starts its bounce back up. Trendline support also happens to be near the 50-day average in this case.
3. Oversold Stochastics
Full stochastics are close to an oversold position in the chart above and that's just what we want. Stochastics, an indicator of a stock's momentum, give us a glimpse at just how overextended a stock's price is at any given time. When a stock is oversold, it's time for us to buy.
Once you see all three things, there is only one more step you need to know after that: Draw a trendline off the most recent highs (pink line). That's what we commonly refer to as a Pullback Off Highs Line. Then it's all about an upside crossover of the stock's share price above that line. That crossover is your entry point.
The following is an excerpt of All About Trends Premium newsletter, sent every day. If you would like to sign up for a free 15 day trial click here (no credit card required).
Loading...
Loading...
© 2024 Benzinga.com. Benzinga does not provide investment advice. All rights reserved.
Benzinga simplifies the market for smarter investing
Trade confidently with insights and alerts from analyst ratings, free reports and breaking news that affects the stocks you care about.
Join Now: Free!
Already a member?Sign in

