Benzinga

España
Italia
대한민국
日本
Français
Benzinga Edge
Benzinga Research
Benzinga Pro

  • Get Benzinga Pro
  • Data & APIs
  • Events
  • Premarket
  • Advertise
Contribute
España
Italia
대한민국
日本
Français

Benzinga

  • Premium Services
  • Financial News
    Latest
    Earnings
    Guidance
    Dividends
    M&A
    Buybacks
    Interviews
    Management
    Offerings
    IPOs
    Insider Trades
    Biotech/FDA
    Politics
    Healthcare
    Small-Cap
  • Markets
    Pre-Market
    After Hours
    Movers
    ETFs
    Options
    Cryptocurrency
    Commodities
    Bonds
    Futures
    Mining
    Real Estate
    Volatility
  • Ratings
    Analyst Color
    Downgrades
    Upgrades
    Initiations
    Price Target
  • Investing Ideas
    Trade Ideas
    Long Ideas
    Short Ideas
    Technicals
    Analyst Ratings
    Analyst Color
    Latest Rumors
    Whisper Index
    Stock of the Day
    Best Stocks & ETFs
    Best Penny Stocks
    Best S&P 500 ETFs
    Best Swing Trade Stocks
    Best Blue Chip Stocks
    Best High-Volume Penny Stocks
    Best Small Cap ETFs
    Best Stocks to Day Trade
    Best REITs
  • Money
    Investing
    Cryptocurrency
    Mortgage
    Insurance
    Yield
    Personal Finance
    Forex
    Startup Investing
    Real Estate Investing
    Prop Trading
    Credit Cards
    Stock Brokers
Research
My Stocks
Tools
Free Benzinga Pro Trial
Calendars
Analyst Ratings Calendar
Conference Call Calendar
Dividend Calendar
Earnings Calendar
Economic Calendar
FDA Calendar
Guidance Calendar
IPO Calendar
M&A Calendar
Unusual Options Activity Calendar
SPAC Calendar
Stock Split Calendar
Trade Ideas
Free Stock Reports
Insider Trades
Trade Idea Feed
Analyst Ratings
Unusual Options Activity
Heatmaps
Free Newsletter
Government Trades
Perfect Stock Portfolio
Easy Income Portfolio
Short Interest
Most Shorted
Largest Increase
Largest Decrease
Calculators
Margin Calculator
Forex Profit Calculator
100x Options Profit Calculator
Screeners
Stock Screener
Top Momentum Stocks
Top Quality Stocks
Top Value Stocks
Top Growth Stocks
Compare Best Stocks
Best Momentum Stocks
Best Quality Stocks
Best Value Stocks
Best Growth Stocks
Connect With Us
facebookinstagramlinkedintwitteryoutubeblueskymastodon
About Benzinga
  • About Us
  • Careers
  • Advertise
  • Contact Us
Market Resources
  • Advanced Stock Screener Tools
  • Options Trading Chain Analysis
  • Comprehensive Earnings Calendar
  • Dividend Investor Calendar and Alerts
  • Economic Calendar and Market Events
  • IPO Calendar and New Listings
  • Market Outlook and Analysis
  • Wall Street Analyst Ratings and Targets
Trading Tools & Education
  • Benzinga Pro Trading Platform
  • Options Trading Strategies and News
  • Stock Market Trading Ideas and Analysis
  • Technical Analysis Charts and Indicators
  • Fundamental Analysis and Valuation
  • Day Trading Guides and Strategies
  • Live Investor Events
  • Pre-market Stock Analysis and News
  • Cryptocurrency Market Analysis and News
Ring the Bell

A newsletter built for market enthusiasts by market enthusiasts. Top stories, top movers, and trade ideas delivered to your inbox every weekday before and after the market closes.

  • Terms & Conditions
  • Do Not Sell My Personal Data/Privacy Policy
  • Disclaimer
  • Service Status
  • Sitemap
© 2026 Benzinga | All Rights Reserved
January 12, 2022 1:00 PM 2 min read

Alibaba Might Be Finally Making A Reversal: Here's Why

by Tyler Bundy Benzinga Staff Writer
Follow

Alibaba Group Holding Ltd - ADR (NYSE:BABA) shares are trading higher Wednesday following data that showed China's inflation rose slower than expected in December, which increased optimism about the easing of policy. The stock looks like it may be finally turning around as it approaches support in a downward channel.

Alibaba was up 3.58% at $136.85 Wednesday afternoon at publication.

See Related: Why Alibaba And Pinduoduo Shares Are Rising

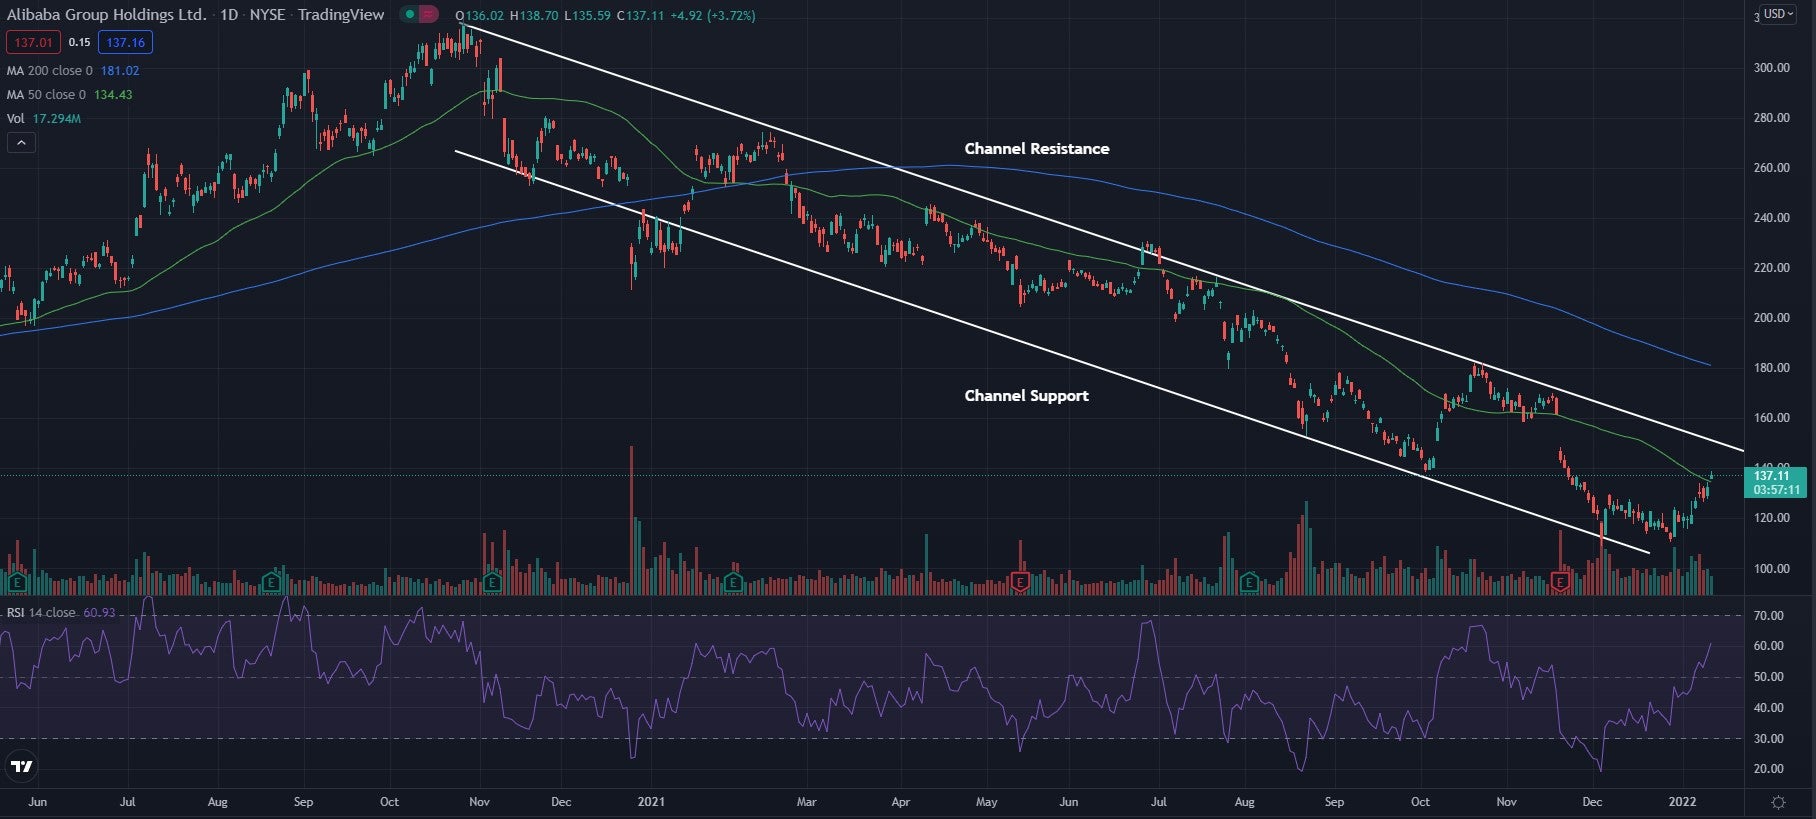
Alibaba Daily Chart Analysis

  • The stock is nearing resistance in what traders call a downward channel. The stock has been unable to cross the pattern resistance in the past which has led to a downward trend. If the stock can cross above this resistance line it may see a change in trend and could begin to form an upward trend.
  • The stock crossed above the 50-day moving average (green) but trades below the 200-day moving average (blue), indicating the stock is likely facing a period of consolidation. The 50-day moving average may now hold as an area of support, while the 200-day moving average may act as resistance.
  • The Relative Strength Index (RSI) has been climbing higher the past month or so and sits at 60. This shows buyers have been moving back into the stock and signals a reversal may be happening.

What’s Next For Alibaba?

Photo: Courtesy Alibaba

Market News and Data brought to you by Benzinga APIs

© 2026 Benzinga.com. Benzinga does not provide investment advice. All rights reserved.

To add Benzinga News as your preferred source on Google, click here.


Posted In:
Long IdeasNewsShort IdeasSmall Cap AnalysisGlobalMoversTrading IdeasChinashopping
BABA Logo
BABAAlibaba Group Holding Ltd
$155.47-0.17%
Overview

The price has been moving in this downward trend for months and now looks like it may be starting to turn around. If the price can cross back above the pattern resistance, it may be a hint the stock is seeing a reversal and could begin to start climbing for a period of time. Bulls are looking for the resistance level to be broken and for the stock to form higher lows. This could show the trend change is coming and a long-term upward trend may be starting. Bears are looking for the price to fall back below the 50-day moving average and for the price to be able to hold below the channel’s resistance.

BABA Logo
BABAAlibaba Group Holding Ltd
$155.47-0.17%
Overview
Comments
Loading...