
Norwegian Cruise Line Holdings Ltd NCLH, Royal Caribbean Cruises Ltd RCL, and Carnival Corp CCL are three cruise line stocks pushing higher Monday.
These stocks are moving up with other travel stocks such as airline stocks after the space rebounded from last week's sell-off due to concerns about the COVID-19 omicron variant.
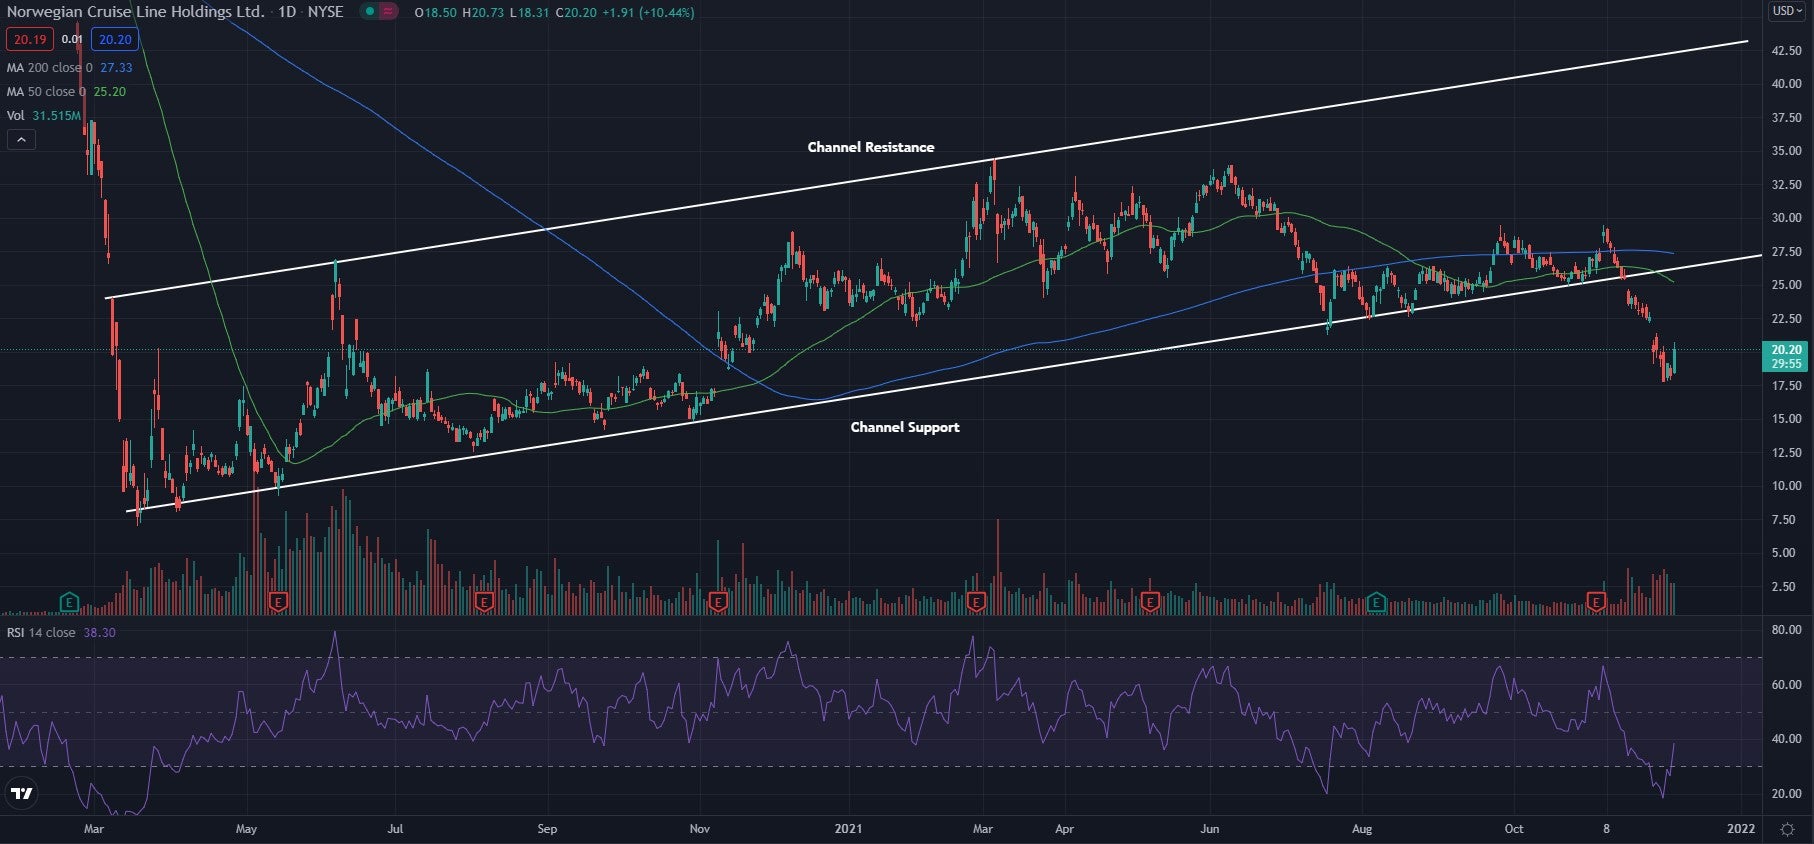
Norwegian Cruise Line Daily Chart Analysis
- Shares look to be bouncing back after falling below what technical traders call an upwards channel.
- Connecting highs and lows of the chart show the stock has been bouncing back and forth between two upward sloping parallel lines. As the stock fell below the channel support, this level may now hold as an area of resistance in the future.
- The Relative Strength Index (RSI) was falling steeply for a time but looks to have bounced back some now sitting at 38 on the indicator. This shows buyers have been moving back into the stock although overall selling pressure still outweighs buying pressure.
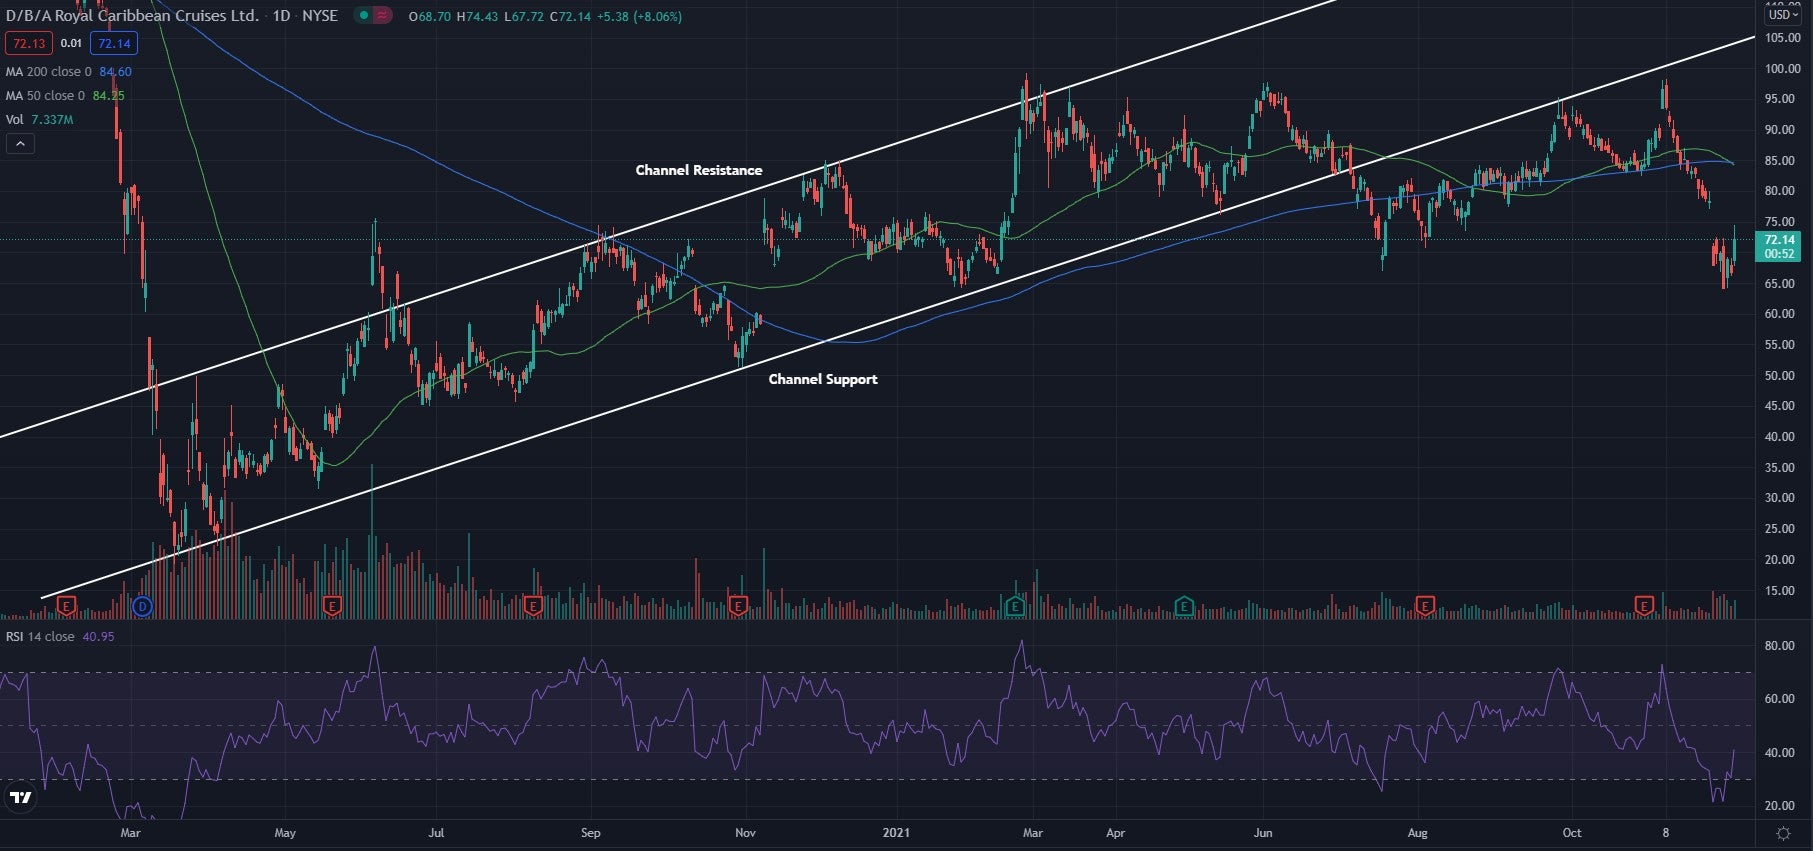
Royal Caribbean Cruise Lines Daily Chart Analysis
- Shares are in a similar situation to Norwegian Cruise Lines, recently falling below support in what technical traders call an upward trending channel.
- Connecting highs and lows of this chart also show a parallel channel with an upward slope. Also like Norwegian Cruise Lines, the stock has fallen below pattern support and is seeing a strong day pushing back toward the resistance level.
- The Relative Strength Index (RSI) is bouncing back after falling for the past few weeks and now sits at 41. This shows more buyers entering the market, but the overall market is dominated by sellers.
Carnival Daily Chart Analysis
- Shares look to have fallen below the higher low trendline in what technical traders call an ascending triangle pattern.
- The stock previously found resistance near the $25 level and was holding the higher low trendline as an area of support. The stock then fell below the higher low trendline and this area may act as resistance.
- The Relative Strength Index (RSI) is bouncing back after falling for the past few weeks and now sits at 40. This shows more buyers entering the market, but overall the market is seeing more selling pressure.
- All three stocks are trading below both their 50-day moving averages (green) and their 200-day moving averages (blue), indicating the recent sentiment in the stocks has been bearish. These averages may hold as resistance in the future.
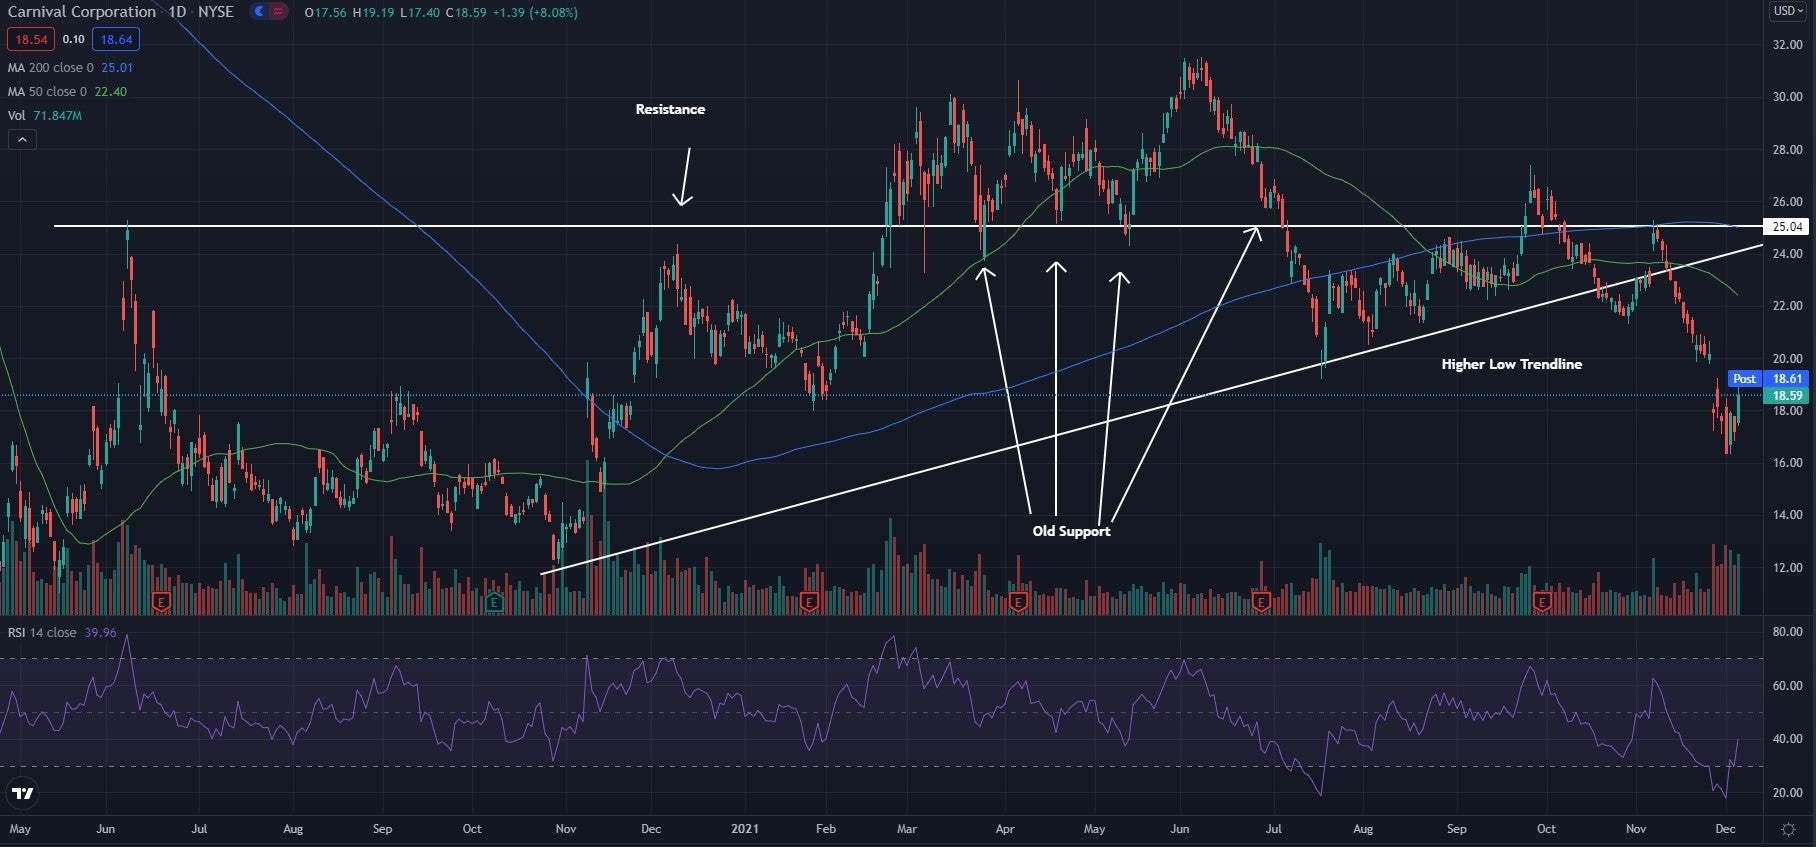
Photo: Courtesy Carnival Corp
© 2024 Benzinga.com. Benzinga does not provide investment advice. All rights reserved.
Comments
Loading...
Benzinga simplifies the market for smarter investing
Trade confidently with insights and alerts from analyst ratings, free reports and breaking news that affects the stocks you care about.
Join Now: Free!
Already a member?Sign in

