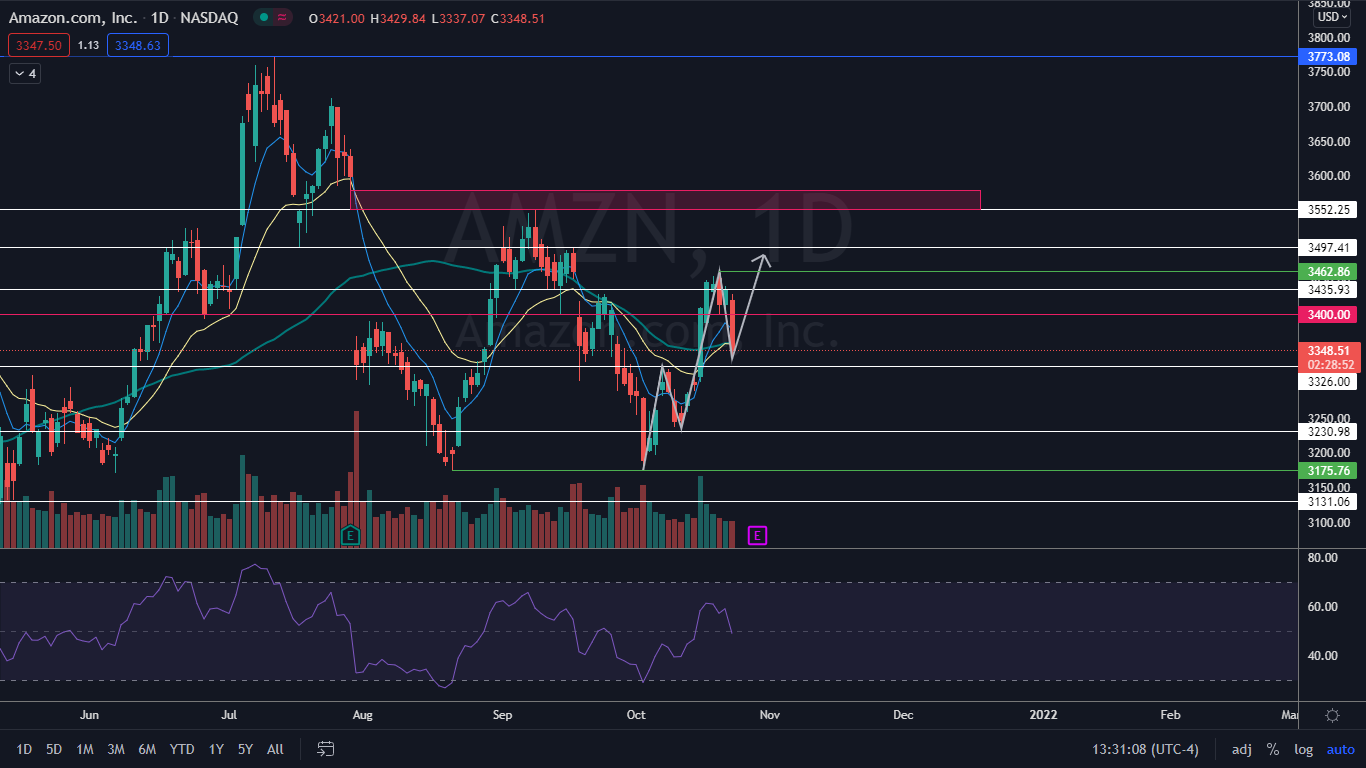
Amazon.com, Inc AMZN created a bullish double bottom pattern on Oct. 4 and reversed course into a solid uptrend. The uptrend has been confirmed by a consistent series of higher highs and higher lows, with the most previous higher high printed on Wednesday at $3462.86 and the most recent higher low at $3230.98 on Oct. 12.
- On Friday, Amazon fell below the $3400 psychological support level, but the bearish action may count as the next higher low.
- The stock needs to trade up over the Oct. 20 high to continue the uptrend. Above the level there is a gap between $3549.99 and $3580.01 that is likely to be filled.
- Amazon has resistance above at $3400, 3435.93 and $3462.86 and support below at $3326, $3300 and $3230.98.
 Want direct analysis? Find me in the BZ Pro lounge! Click here for a free trial.
© 2024 Benzinga.com. Benzinga does not provide investment advice. All rights reserved.
Comments
Loading...
Benzinga simplifies the market for smarter investing
Trade confidently with insights and alerts from analyst ratings, free reports and breaking news that affects the stocks you care about.
Join Now: Free!
Already a member?Sign in

