
On Wednesday evening, Benzinga asked its Benzinga Pro community which tickers they’d like analyzed. From the replies, Benzinga selected these two tickers for technical analysis.
Pro user Chrystal wanted to see a technical analysis on Unity Software Inc (NYSE:U), while khalid chose Snap Inc (NYSE:SNAP).
Both stocks look bullish heading forward although any bullish chart can be negated by a turn in the overall markets and the key employment data expected Friday morning could set the course for the month of October.
See Also: Why Snap Shares Are Rising
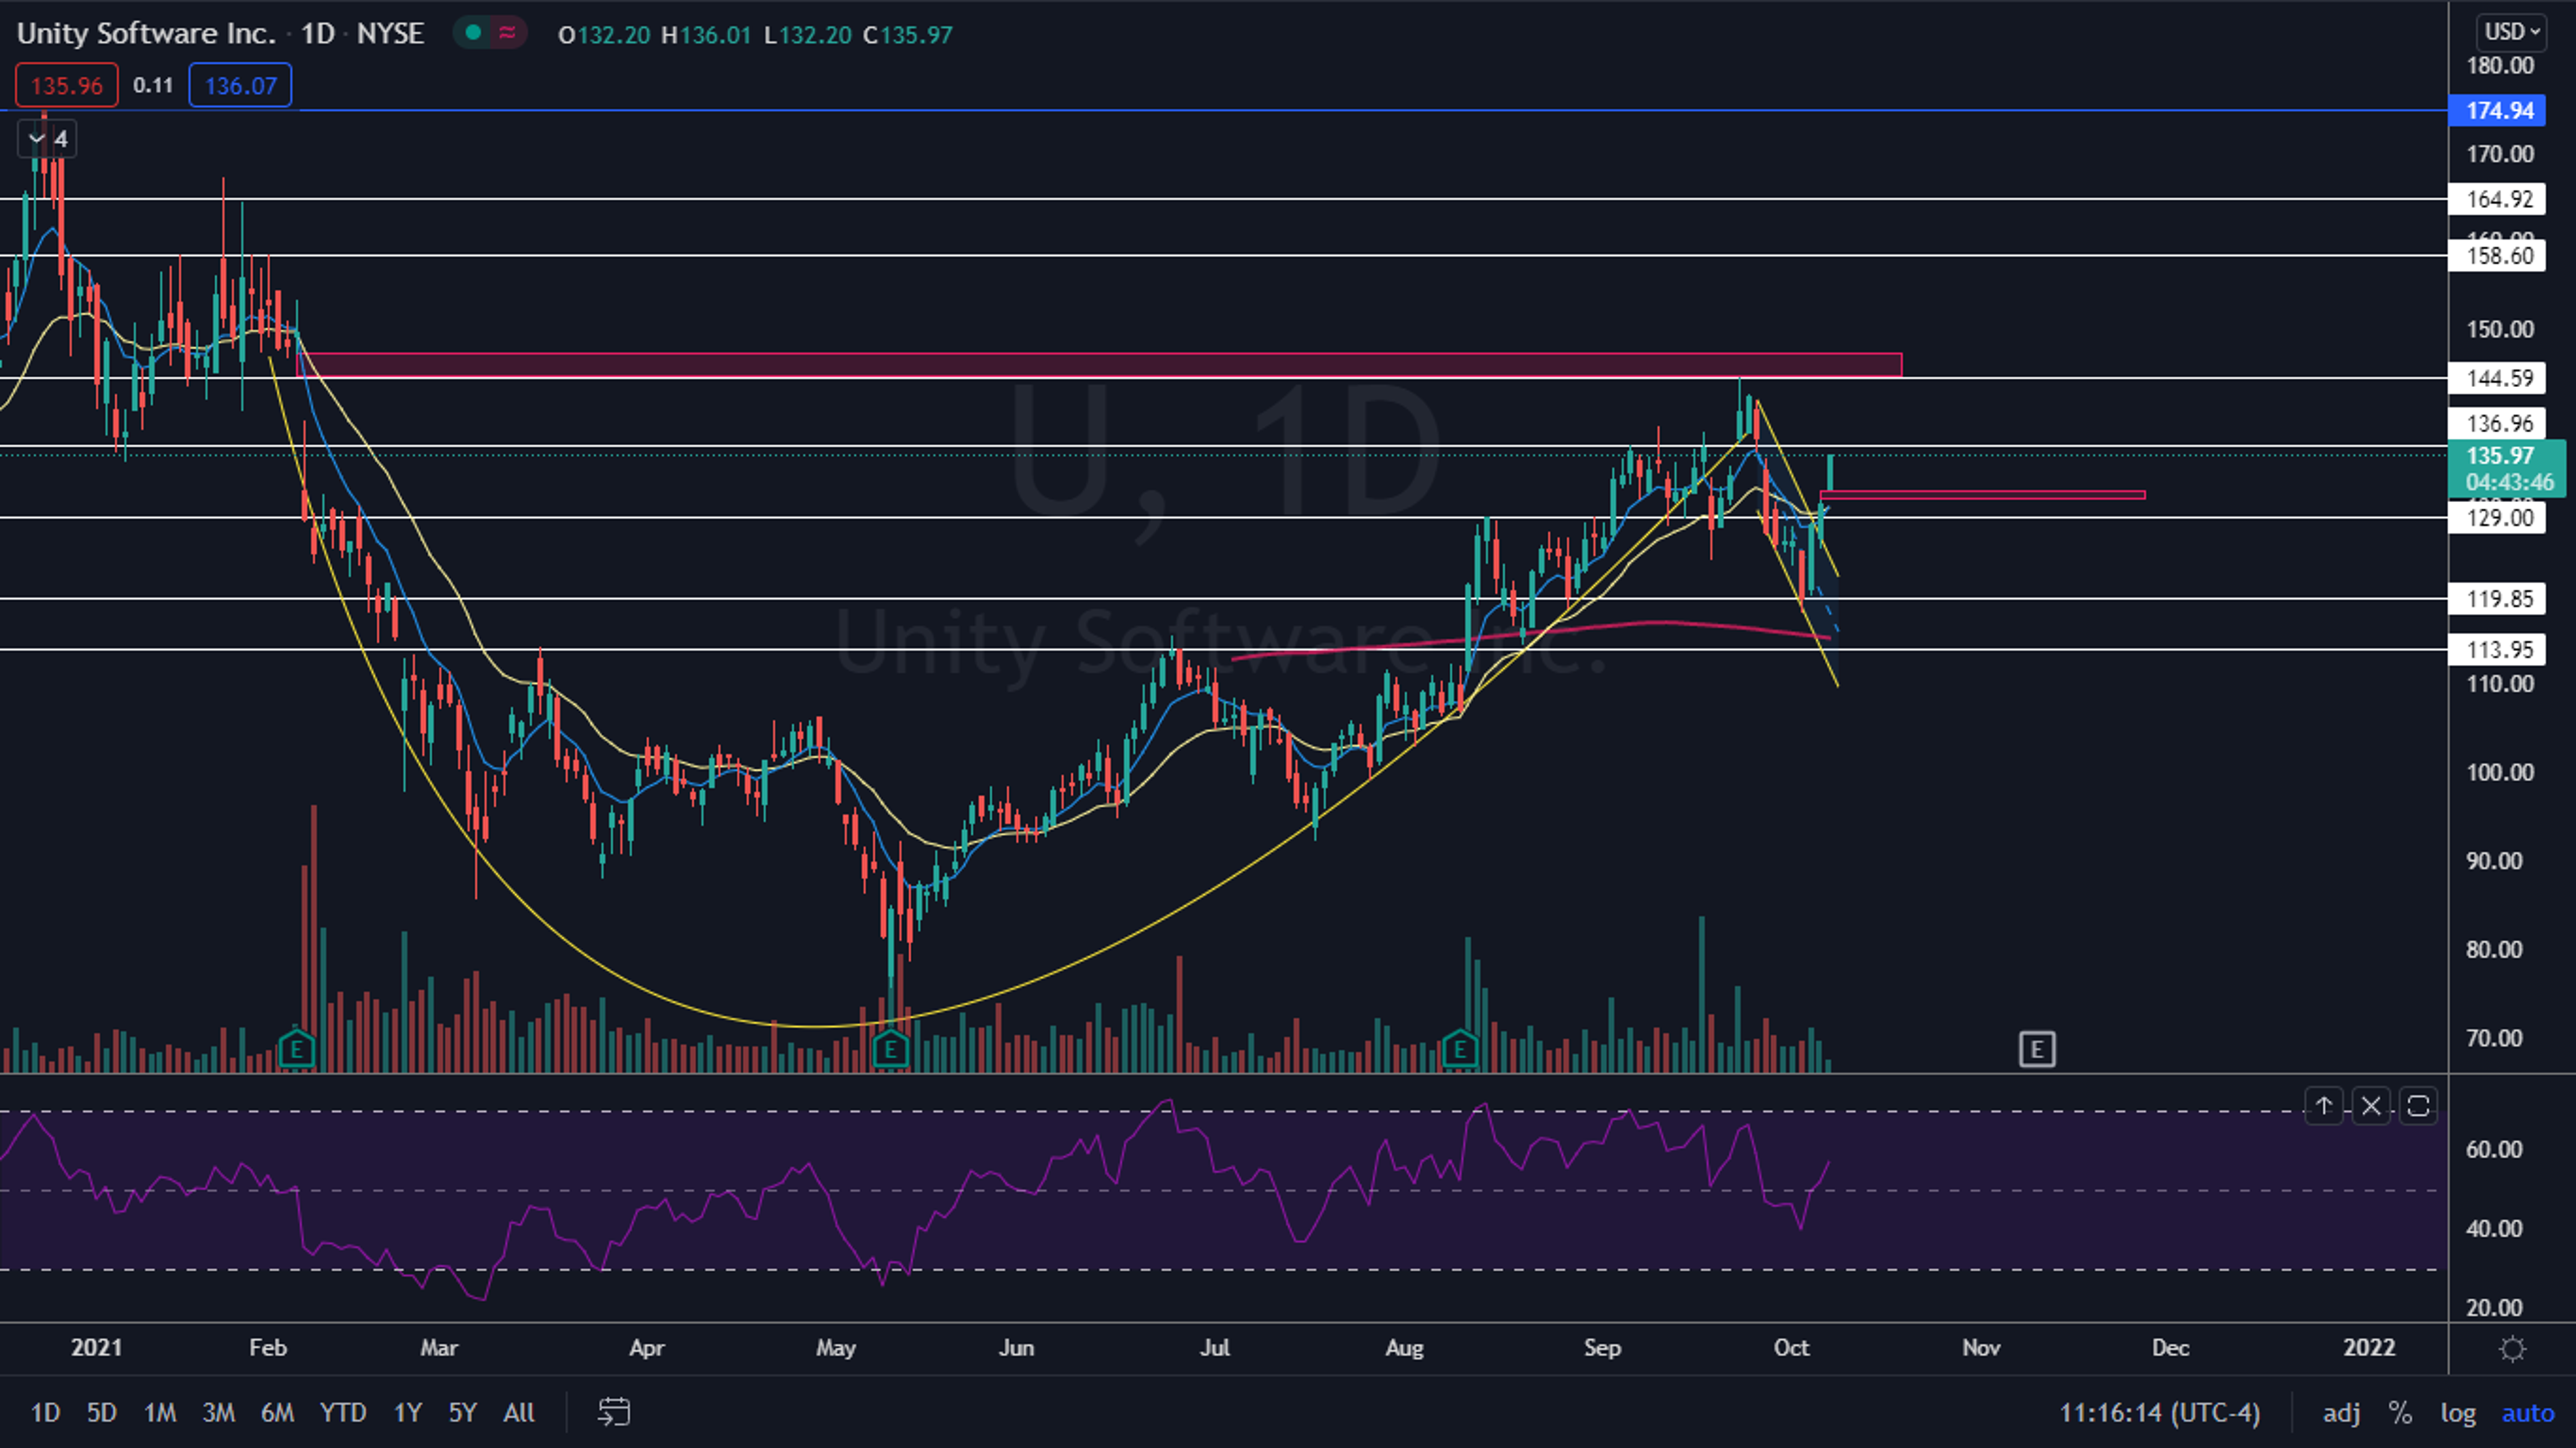
The Unity Chart: On Wednesday, Unity may have broken up from a bullish cup and handle pattern on the daily chart with the rounded cup created between Feb. 4 and Sept. 24 and the downward sloping handle formed between Sept. 27 and Oct. 5. When the stock broke from the pattern it printed a bullish Marubozu candlestick, which for technical traders indicated higher prices were likely to come.
On Thursday, Unity gapped slightly and big bullish volume came in and drove the stock up toward a higher resistance at $136.96. Gaps on charts are filled 90% of the time, so it's likely Unity will trade down to fill the lower gap in the future. Because the gap is close by, the stock may fill it when it puts it eventually puts in a higher low, which would also confirm a bullish trend change.
Unity also has a gap above between $144.75 and $147.50 which is likely to be filled at some point. The stock will have to regain two resistance levels at $136.96 and $144.59 in order to reach the gap.
The stock is trading above the eight-day and 21-day exponential moving averages (EMAs), and on Thursday morning the eight-day EMA crossed above the 21-day, both of which are bullish indicators. Unity is also trading above the 200-day simple moving average (SMA), which indicates overall sentiment is bullish.
- Bulls want to see big bullish volume come in to drive Unity back up above the $137 mark. Consolidation in the form of a higher low will be needed either below or above the level.
- Bears want to see big bearish volume come in and drop Unity back down below the $129 mark. If the stock loses the area as support it could fall back into the handle formation and eventually lose another support level at $119.85.

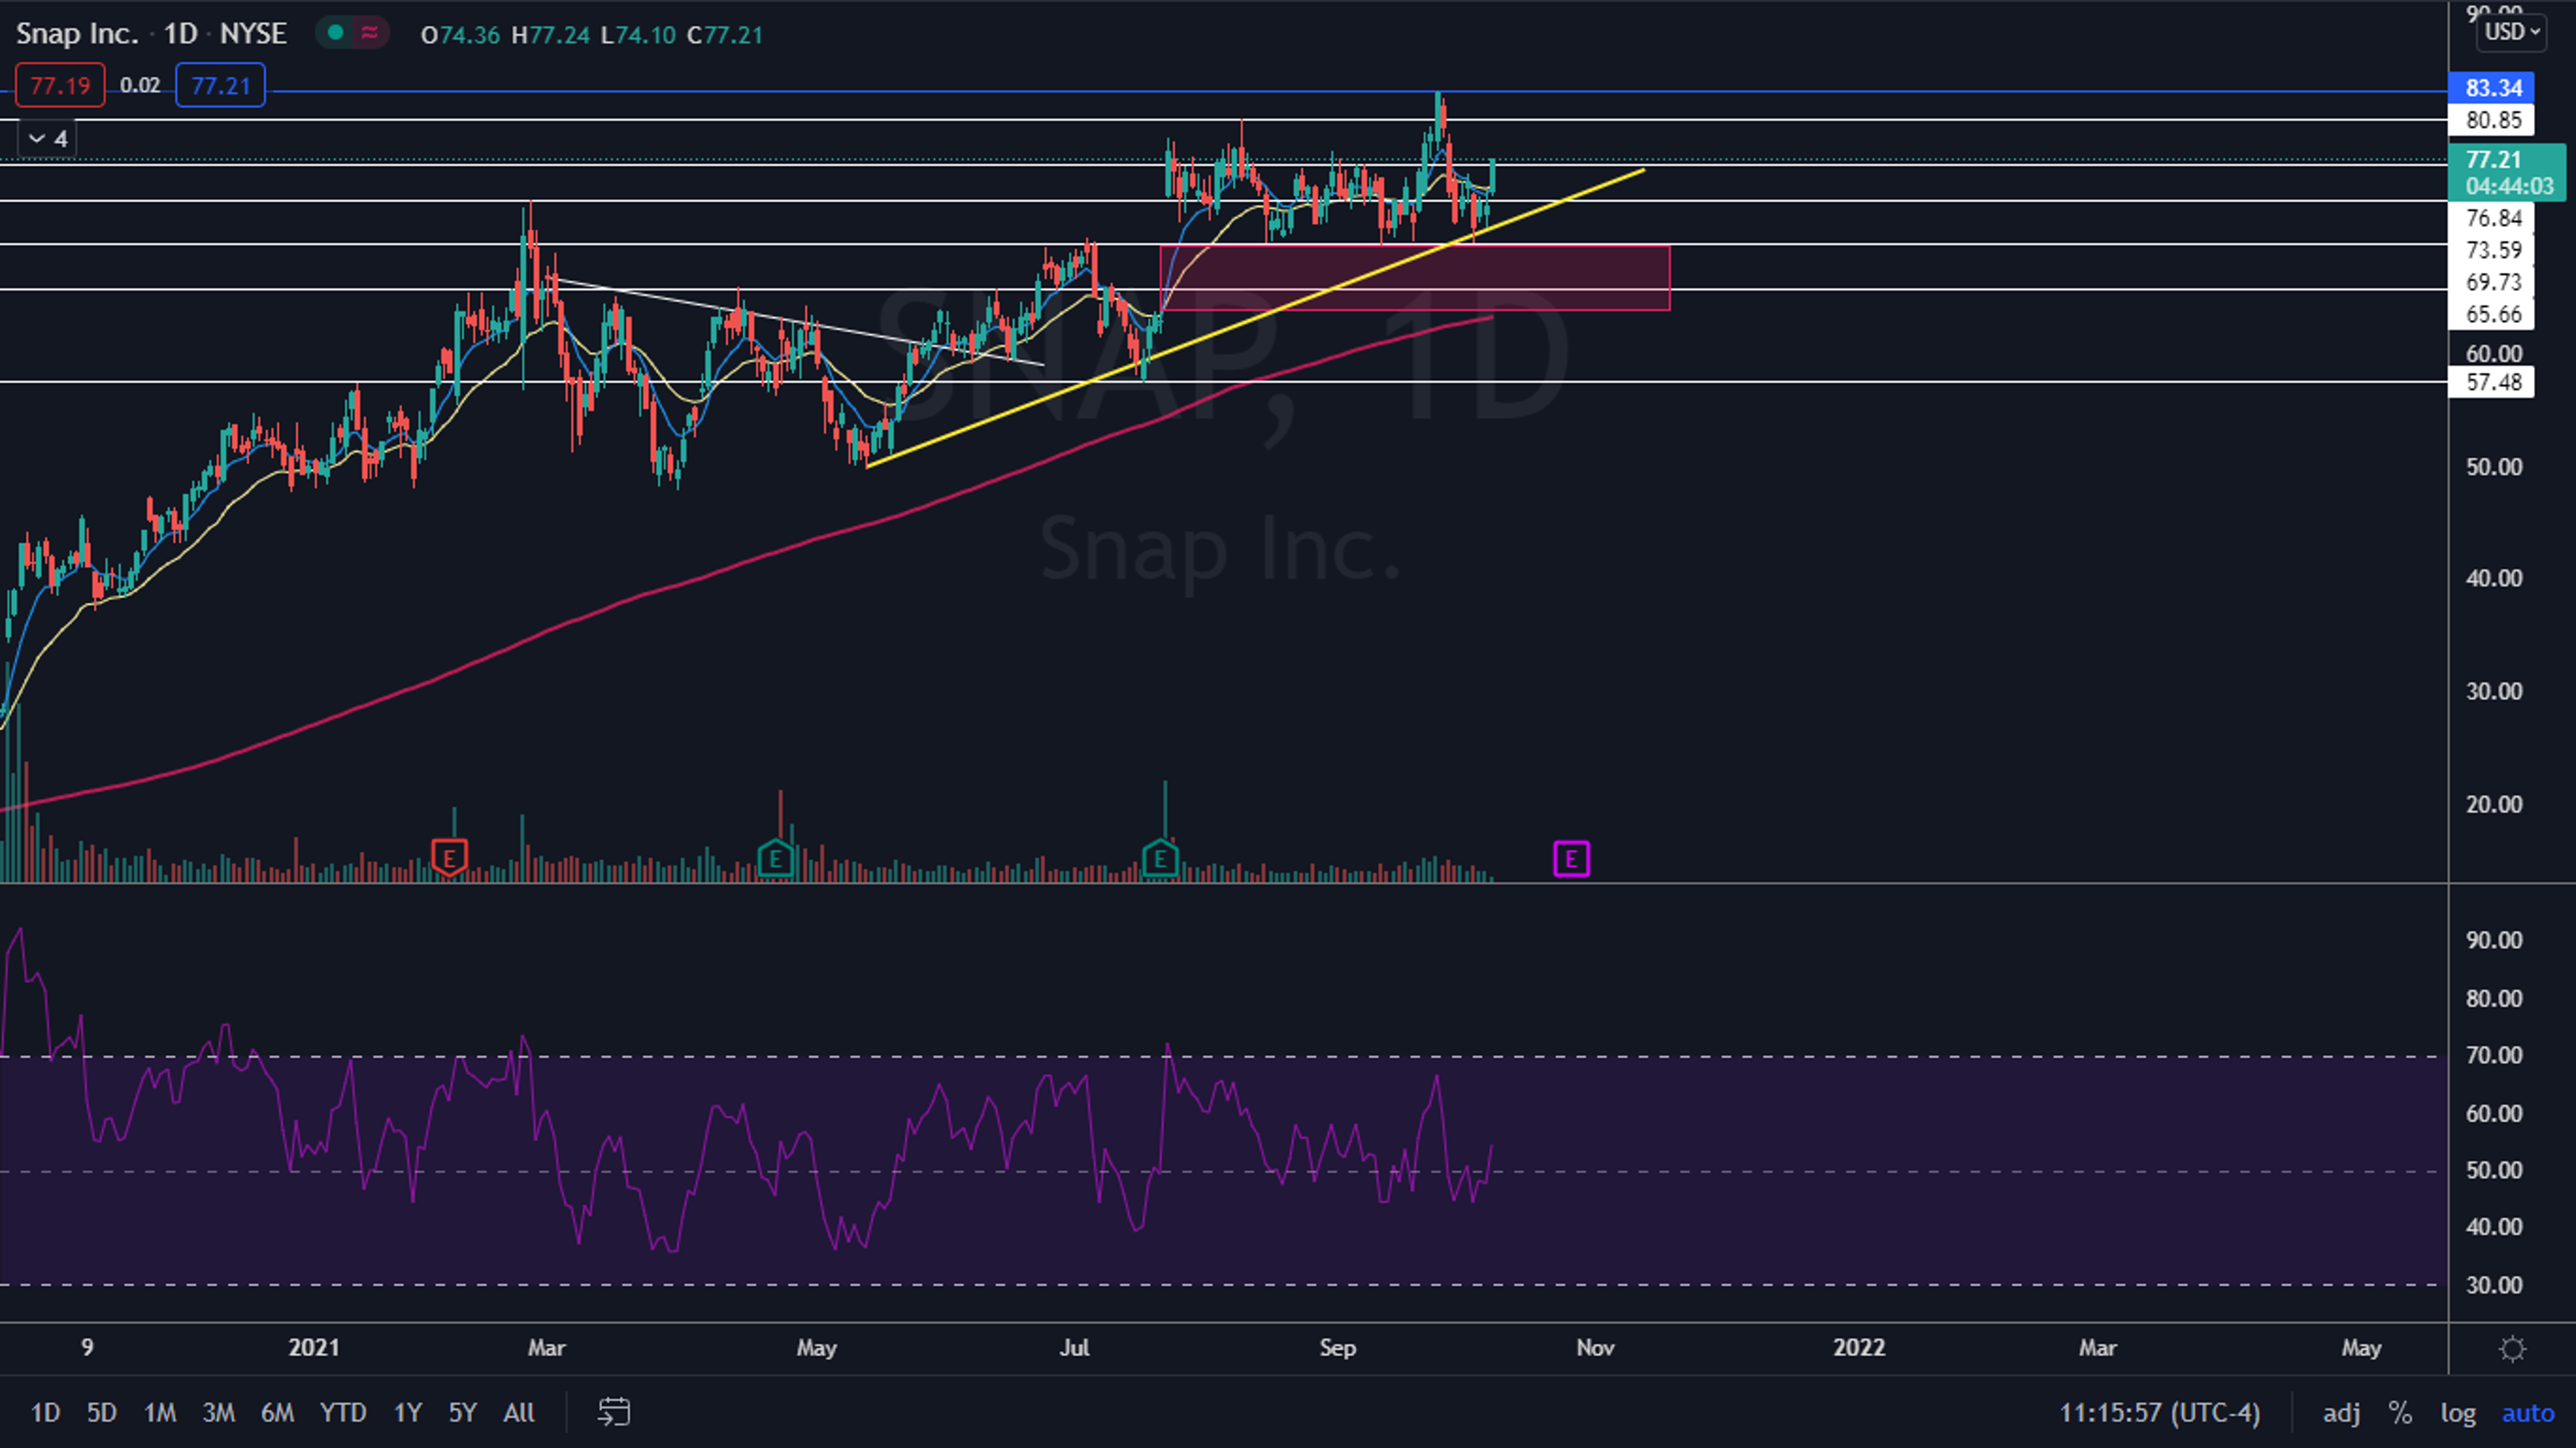
The Snap Chart: On Wednesday Snap tested support at an ascending trendline that has been propping the stock up since May 13 and bounced. Although the stock has traded below the trendline on two occasions, it has never closed a trading session below the level, which indicates the trend is being recognized.
On Thursday Snap popped up above a resistance level at $73.59, ran toward a higher resistance near the $77 level and began to consolidate sideways on lower timeframes. If Snap can close the day near its high-of-day price, it will print a bullish Marubozu candlestick, which could indicate higher prices will come again on Friday.
Like Unity, Snap is trading above the eight-day and 21-day EMAs, as well as the 200-day SMA, all of which are bullish indicators. If the stock is able to close the day above the $76.84 level the eight-day EMA will cross above the 21-day, which will give bulls confidence going forward.
- Bulls want to see increasing bullish volume help Snap to close the trading day above the $77 level. If the stock regains the level as support, it has room to move up toward the $80.85 level, which will put it in reach of its Sept. 24 all-time high of $83.34.
- Bears want to see big bearish volume come in and drop the stock back down below the $73.50 mark, which would cause Snap to also lose support of the EMAs. Below the level, Snap has support at the ascending trendline.
© 2025 Benzinga.com. Benzinga does not provide investment advice. All rights reserved.