
On Thursday evening, Benzinga asked its followers on Twitter which calls or stocks they’re buying for lotto Friday. From the replies Benzinga selected one ticker for technical analysis. @tatcoinguy, @justinkleppe, and @Stephen18644932 are all watching AMC Entertainment Holdings, Inc AMC, a popular Reddit stock.
AMC’s stock rose to popularity in January along with GameStop Corporation GME when traders looked into the underlying statistics of a number of different stocks and discovered discrepancies and irregularities. Although some of AMC’s statistics have normalized somewhat, the stock still makes a great short squeeze candidate due to the following:
- Relatively small float: AMC has 511.47 million shares available for trading.
- High Ownership: 25.25% of AMC’s shares are held by institutions.
- Short Interest: 92.42 million shares, meaning 18.07%, of AMC’s float is held short, this number is up from 79.75 million in July and doesn't include naked short positions.
See Also: Stock Wars: AMC Vs. IMAX
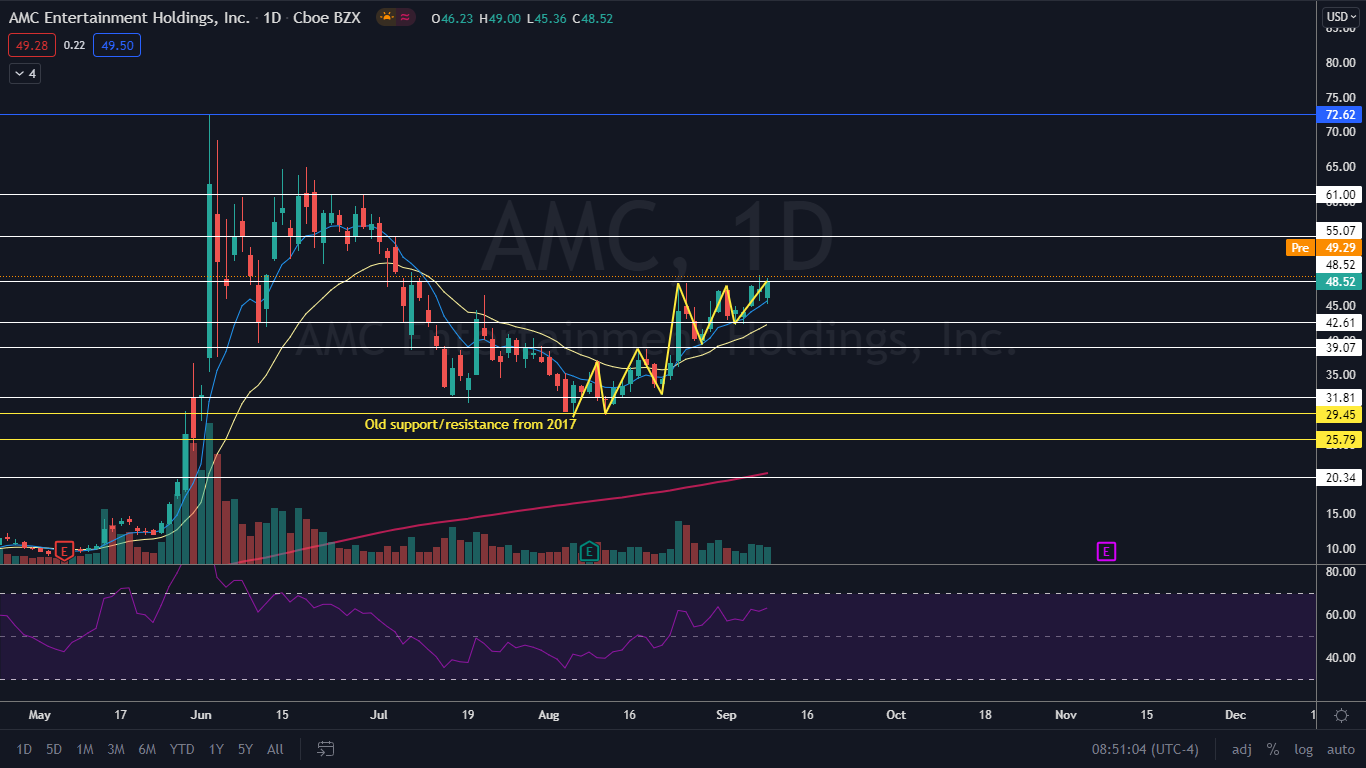
The AMC Chart: AMC made a new all-time high of $72.62 on June 2 before falling into a months-long downtrend that slowly dropped it down almost 60% to the $28 level. The level was a key support and resistance level made in 2017. The stock reversed course Aug. 5 and entered into an uptrend and has been making almost consistent higher highs and higher lows as it treks north.
AMC closed Thursday right on a resistance level at $48.52 and printed a bullish Marubozu candlestick, indicating higher prices may come on Friday. In the premarket the stock looked as though it may gap up above the level and run further.
Short-term traders will want to keep an eye on AMC’s relative strength index (RSI), which has been climbing in line with the share price. On Thursday the stock’s RSI measured in at about 64%.
If big bullish volume comes in and drives the price up significantly higher the RSI could reach or exceed 70%, which would be a sell signal. When the stock reached an RSI of over 70% in June, AMC entered into its downtrend and history often repeats, although a stock’s RSI can remain extended for a long period of time.
AMC is trading above the eight-day and 21-day exponential moving averages with the eight-day EMA trending above the 21-day, both of which are bullish indicators. The stock is also trading about 132% above the 200-day simple moving average, which is bullish although, again, becoming extended.
- Bulls want to see above-average volume come in and push AMC up firmly over resistance at the $48 level and for continuation to drive the stock up over its next resistance level just below the $55 mark. The stock may need to enter into consolidation to drop the RSI slightly before jumping over the higher level.
- Bears want to see big bearish volume come in and drop AMC back down below support at the $42 mark which would also negate the uptrend. If AMC trades below the level, it could fall $39.
© 2024 Benzinga.com. Benzinga does not provide investment advice. All rights reserved.
Comments
Trade confidently with insights and alerts from analyst ratings, free reports and breaking news that affects the stocks you care about.

