
Jefferies launched coverage on Virgin Galactic Holdings, Inc SPCE with a Buy rating and a price target of $33. Analyst Greg Konrad forecasts the space tourism company to bring in revenues of $1.7 billion driven by additional space ships completing 660 flights per year by 2030.
Virgin Galactic’s stock reached a high of $57.51 on June 28 in anticipation of Sir Richard Branson’s successful July 11 flight to the edge of the space but has since sold about 57%. The sharp downtrend was propelled when the company announced a $500 million shelf offering of common stock the day following the historic flight and subsequently received a downgrade to Underperform with a price target of $25 from Morgan Stanley on Aug. 11.
See Also: 5 Stocks Retail Investors Have Eyes On Amid Richard Branson-Fueled Space Excitement
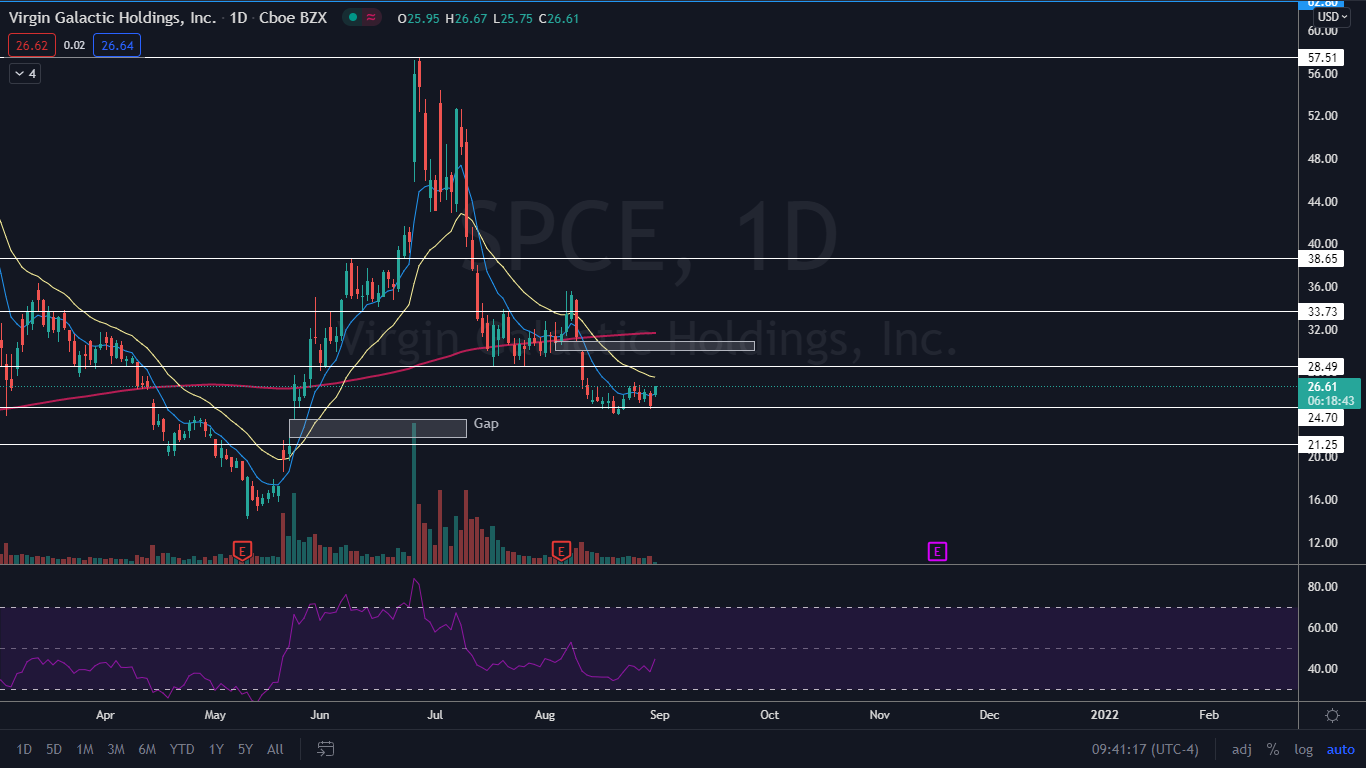
The Virgin Galactic Chart: Virgin Galactic gapped down about 2.5% and fell another 13% following the downgrade, which put the stock square at the $25 level. The stock has since traded in a tight sideways pattern in consolidation between the $23.99 and $27.04 level for the past 12 trading days.
The sideways action has taken place with relatively low volume on the daily chart, which demonstrates there are not a lot of buyers or sellers. Virgin Galactic tested a support level near the $24.70 level on six separate occasions and held above it, however, which indicates the bottom is in at least temporarily.
There are two gaps on Virgin Galactic’s chart: one below between $21.84 and $23.52 and a gap above at the $30 level. Because gaps fill about 90% of the time, it's likely Virgin Galactic’s stock will trade into each range at some point in the future.
On Tuesday morning Virgin Galactic’s stock regained support of the eight-day exponential moving average (EMA) but is still trading below the 21-day EMA with the eight-day EMA trending below the 21-day, which indicates short-term sentiment could be changing. If the stock can regain support of the 21-day EMA and trade above it for a number of days, the eight-day EMA will cross above the 21-day which would turn sentiment bullish.
Virgin Galactic is trading below the 200-day simple moving average which indicates overall sentiment in the stock is bearish.
- Bulls want to see big bullish volume come in and drive Virgin Galactic’s stock up over the 21-day EMA and for momentum to push it up above resistance at the $28.49 level. If the stock can regain the level as support, it has room to move up to fill the overhead gap.
- Bears want to see big bearish volume come in and drop the stock down below support at $24.70. If the stock loses the level, it's likely to fill the gap below.
© 2024 Benzinga.com. Benzinga does not provide investment advice. All rights reserved.
Comments
Trade confidently with insights and alerts from analyst ratings, free reports and breaking news that affects the stocks you care about.

