The following stocks are currently in the midst of strong uptrends according to VantagePoint, an AI charting platform that uses intermarket analysis and artificial intelligence to predict future price action 1-3 days in advance. For a more detailed look at VantagePoint's charts, click here.
A couple of things to know in order to understand the charts below:
- Each chart is a 3-month chart. Candles represent one day of trading
- The blue line is a predicted moving average, and the black line is a simple 10-day moving average
- When the blue line crosses above the black, that's a bullish signal. When the black crosses over the blue, that's bearish
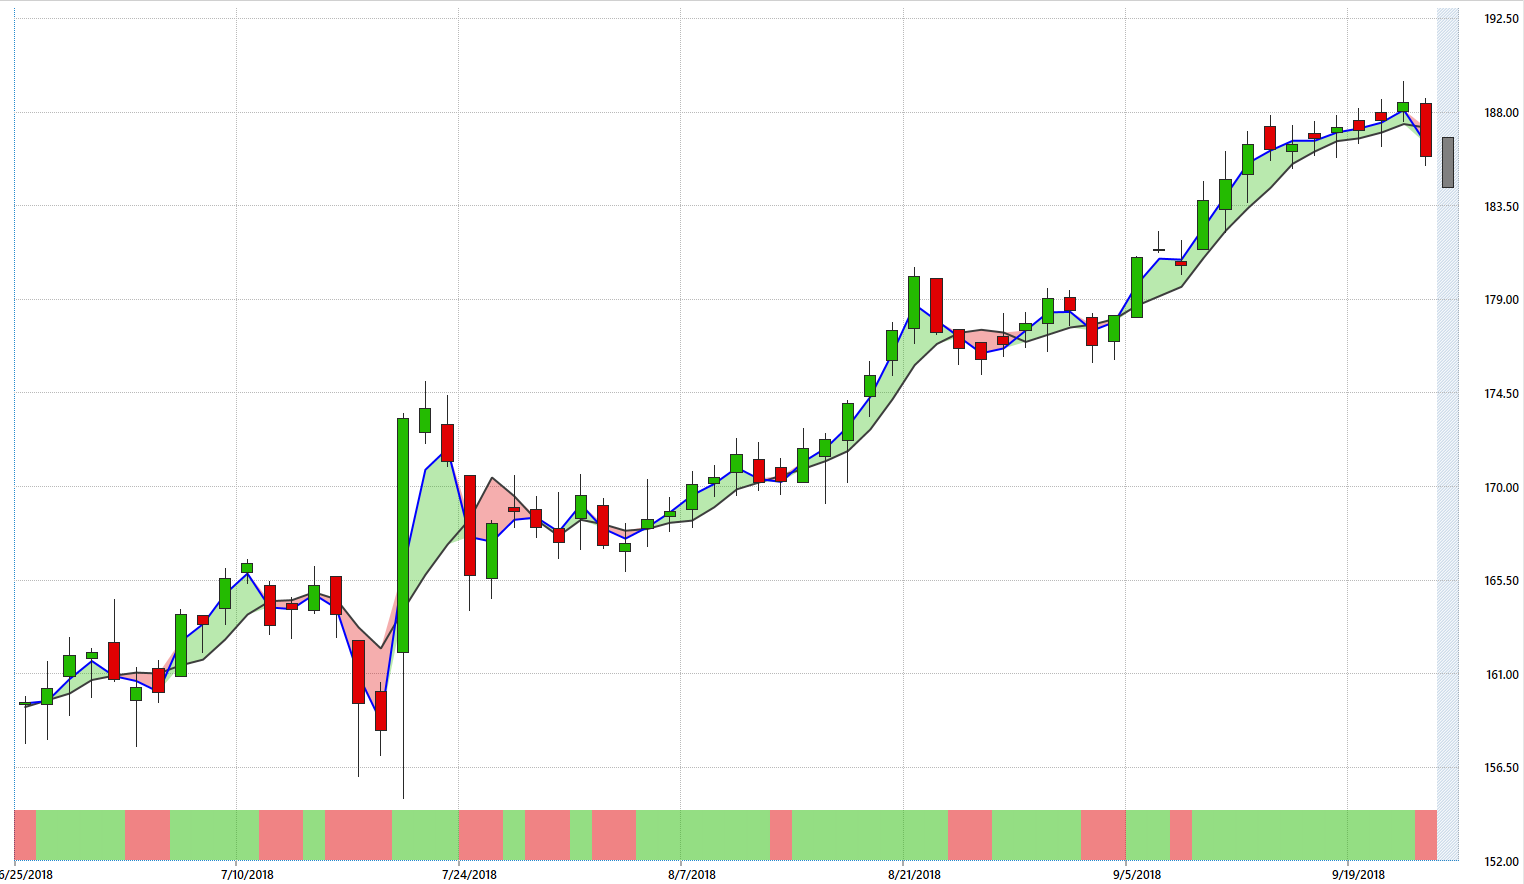
Snap-On
Snap-on Incorporated SNA has rallied hard into fall. Shares of SNA are up nearly 29 percent from the 2018 lows of $142 in May, and the stock hit an all-time high of $189.46 on Friday. Despit that, it appears Snap-on is in for some temporary weakness. The blue line on this chart, a one-day predicted moving average, has crossed over the black simple moving average. When combined with the red neural index at the bottom of the chart, we can say that SNA will likely be weak for at least the next day. SNA traded down 1.7 percent on Tuesday.
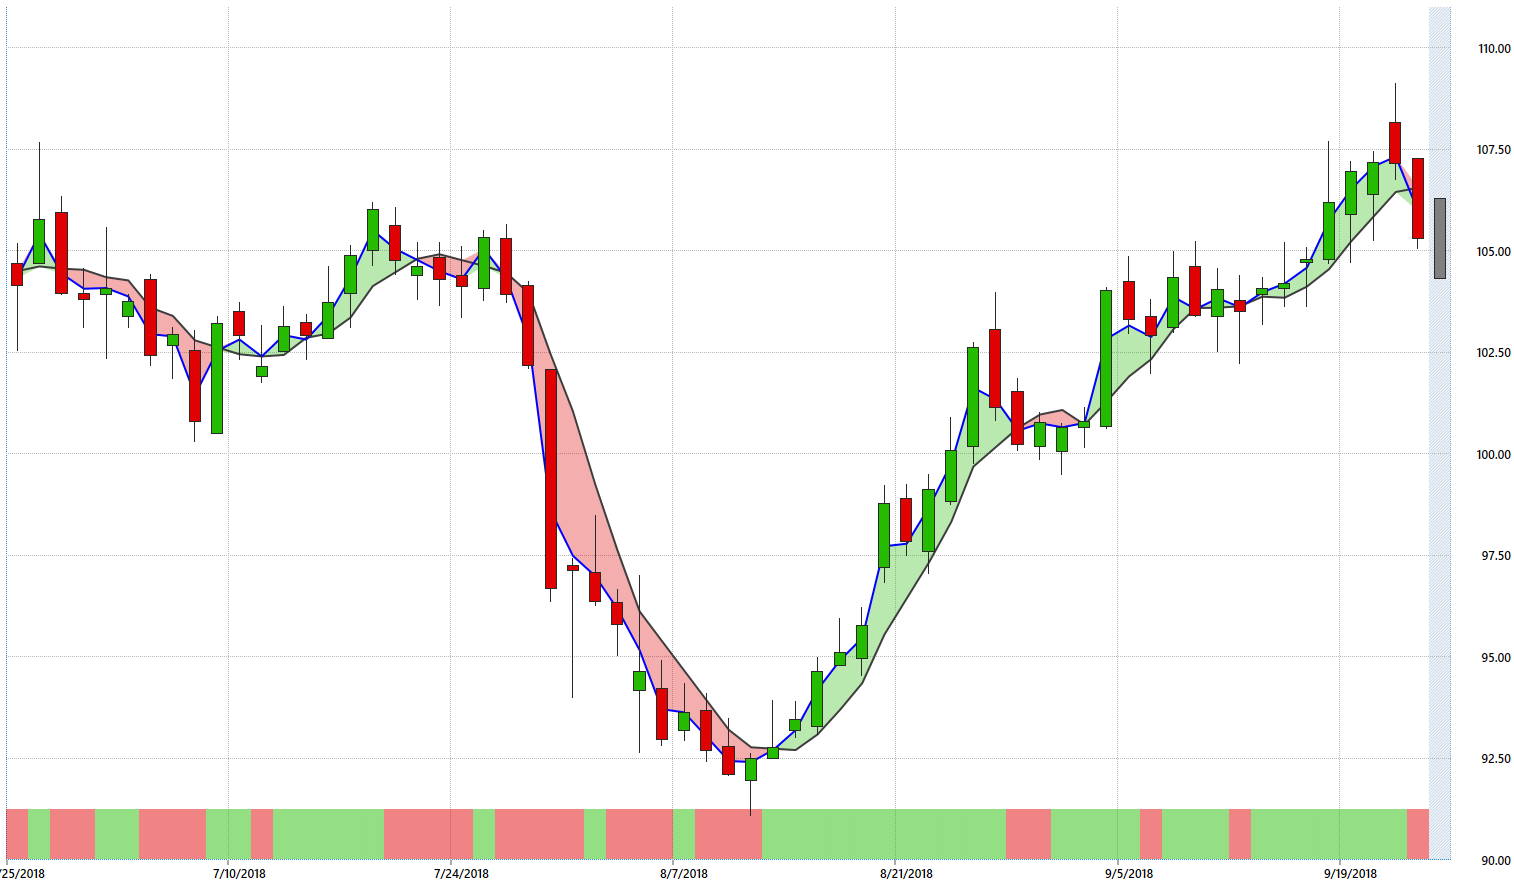
CBOE Holdings
CBOE Global Markets Inc CBOE has a similar trend. Since crossing over into an uptrend on August 13, CBOE rose nearly 18 percent. But the stock has been weak the last three days, falling over 6 percent. VantagePoint's two main indicators are forecasting continued downside into Wednesday's session.
Applied Materials
Applied Materials, Inc. AMAT has had the opposite story. Shares of AMAT are down over 18 percent since reporting disappointing earnings on August 16, and the stock has steadliy fallen since then. Though the strength of that downtrend has obviously weakened in the last week or so, VantagePoint is still forecasting more downside until the blue line crosses above the black.

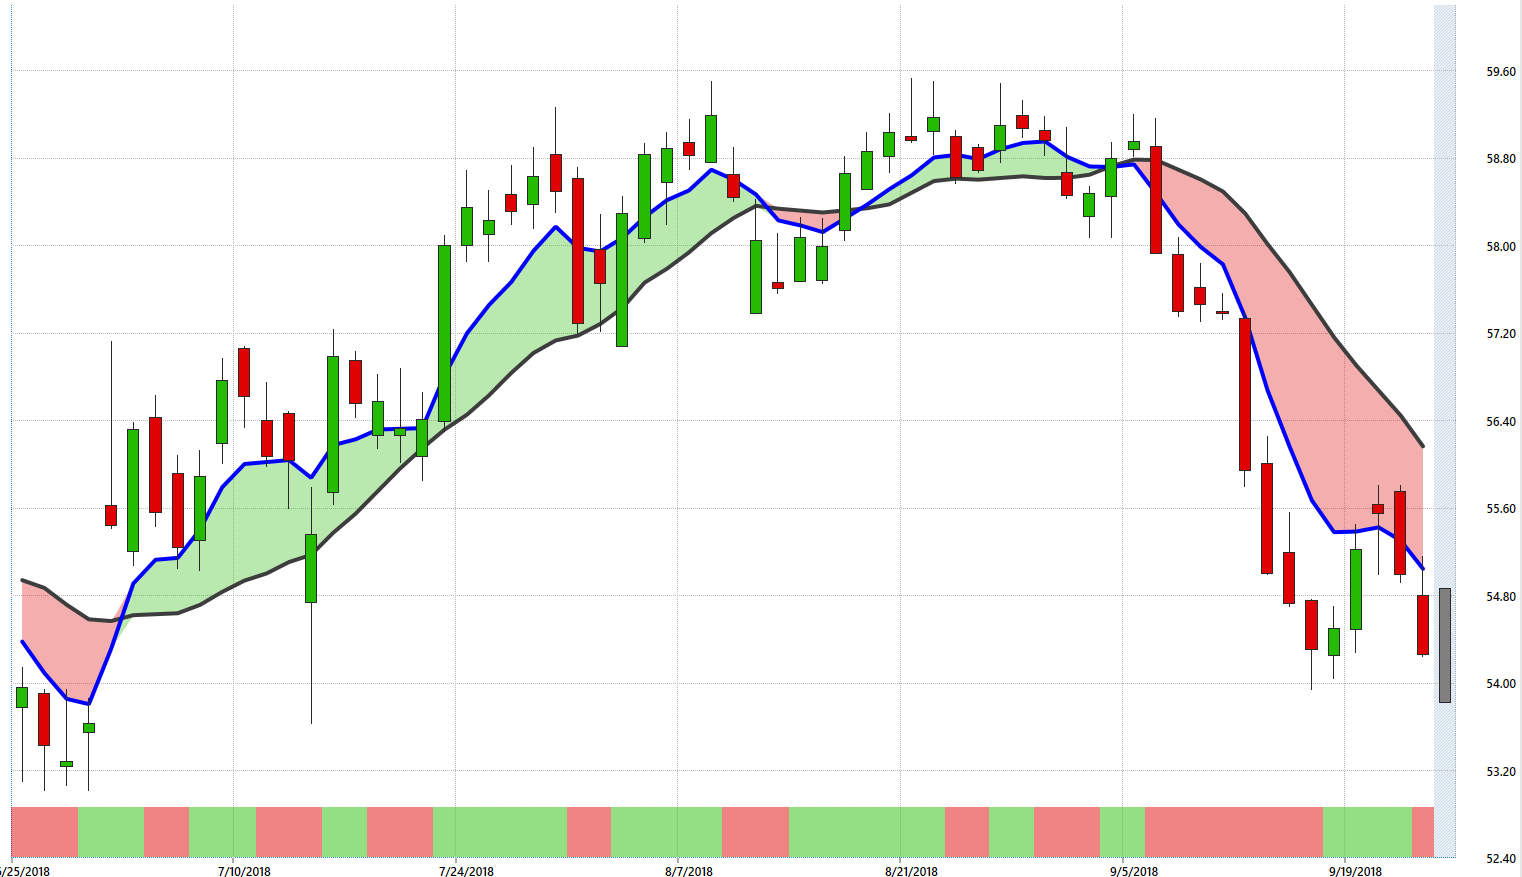
Wells Fargo
Wells Fargo & Co WFC is down over 7 percent since September 6, the day the stock clearly reversed into a downtrend. The distance between the two moving averages on VantagePoint's chart indicate that this trend is still very much intact despite two up days last week. WFC was flat in Tuesday's session.
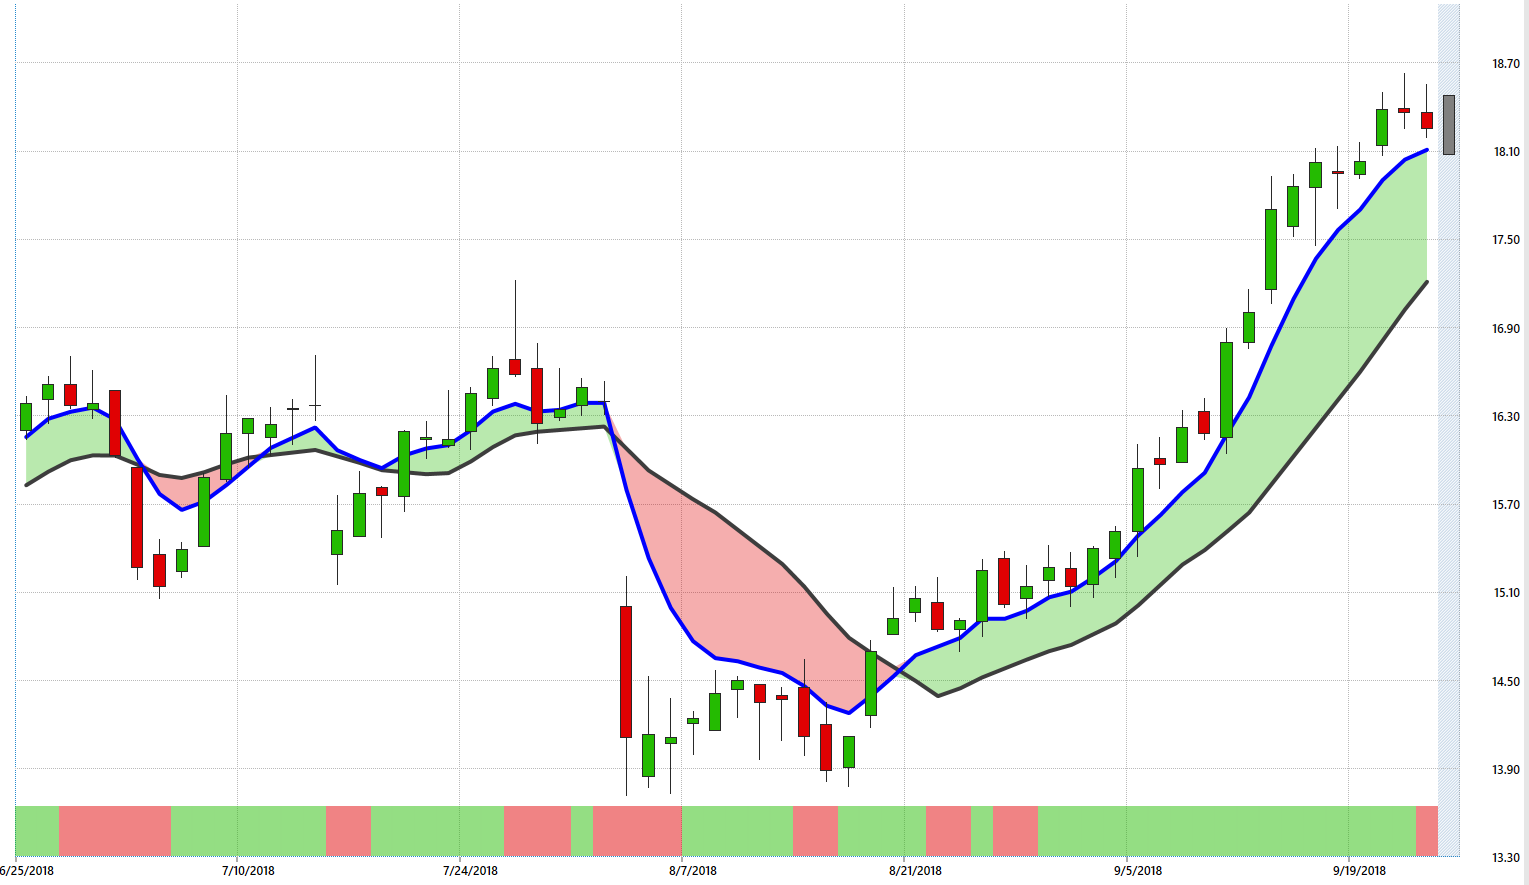
Sally Beauty
Sally Beauty Holdings, Inc. SBH has completely reversed since its earnings report on August 2. Since then, SBH is up 33 percent to its highest prices since January. Though VantagePoint's Neural Index is forecasting potential temporary weakness, this uptrend looks strong enough to continue at least through the end of this week.
VantagePoint is a content partner of Benzinga. For a free demo, click here. `
© 2024 Benzinga.com. Benzinga does not provide investment advice. All rights reserved.
Comments
Trade confidently with insights and alerts from analyst ratings, free reports and breaking news that affects the stocks you care about.

