


We have to wonder as see markets fading quickly if many REITs had experienced a false spring rally and are now correcting. A recent report suggested that over one third of shopping malls will disappear in the coming years due to the growth in ecommerce. Further economic growth globally has been turning over which should negatively affect many malls and office complexes. Due to the inability to obtain mortgages to buy a home one area of growth remains in multi-family housing.
Rising on the back of multi-family housing many REITs performed quite well in the first quarter of 2012. Retail investors and financial advisors are quite yield-driven in their hunt for assets in the income oriented category. REITs offer good yields and demographics in the U.S. especially feature an investor appetite for higher dividends. However, investors should be careful to remember often dividends can be combined with return of principal making for potential tax considerations.
ETFs are based on indexes tied to well-known index providers including Russell, S&P, Barclays, MSCI, Dow Jones and so forth. Also included are some so-called “enhanced” indexes that attempt to achieve better performance through more active management of the index.
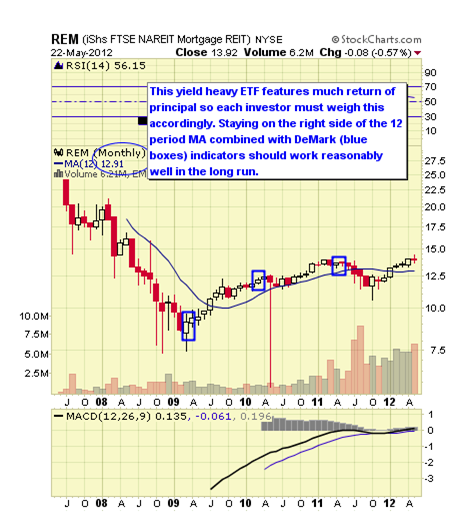
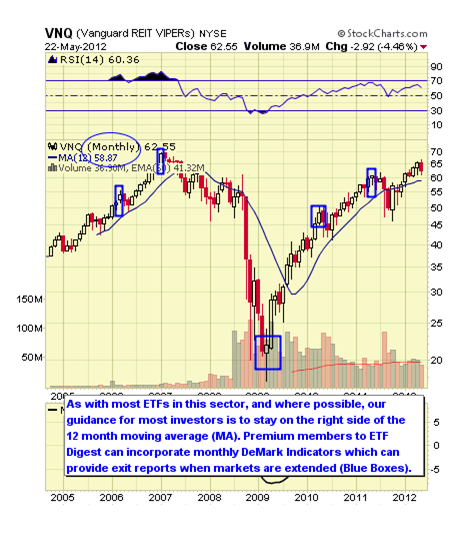
We feature a technical view of conditions from monthly chart views. Simplistically, we recommend longer-term investors stay on the right side of the 12 month simple moving average. When prices are above the moving average, stay long, and when below remain in cash or short. Premium members to the ETF Digest receive added signals when markets become extended such as DeMark triggers to exit overbought/oversold conditions.
For traders and investors wishing to hedge, leveraged and inverse issues are available to utilize from ProShares and Direxion and where available these are noted.
#10. FTSE NAREIT Mortgage REIT ETF REM


REM follows the FTSE NAREIT All Mortgage Capped Index which consists of the residential and commercial real estate, mortgage finance and savings associations in the U.S. equity market. The fund was launched in May 2007. The expense ratio is 0.48%. AUM equal $372M and average daily trading volume is over 283K shares. As of May 2012 the annual dividend yield was 8.63% with YTD return 9.95%. The 1 YR return was 0.43%.
NOTE: Dividend yields include return of principal and yields are dependent on each investor’s income tax situation.
Data as of May 2012
REM Top Ten Holdings & Weightings
- Annaly Capital Management, Inc. (NLY): 20.45%
- American Capital Agency Corp. (AGNC): 19.54%
- Chimera Investment Corporation (CIM): 6.19%
- Hatteras Financial Corporation (HTS): 5.13%
- Starwood Property Trust, Inc. (STWD): 4.91%
- Two Harbors Investment Corp (TWO): 4.11%
- MFA Financial, Inc. (MFA): 4.10%
- Invesco Mortgage Capital Inc (IVR): 4.02%
- CYS Investments Inc (CYS): 3.90%
- Capstead Mortgage Corporation (CMO): 3.15%
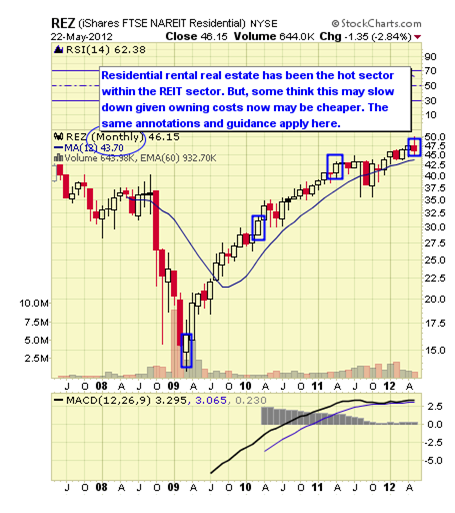
#9. iShares FTSE NAREIT Residential ETF REZ
REZ follows the FTSE NAREIT All Residential Capped Index which measure the residential real estate, healthcare and self storage sectors of the U.S. market. The fund was launched in May 2007. The expense ratio is 0.48%.
AUM equal $186M and average daily trading volume is around 40K shares. As of May 2012 the annual dividend yield was 2.22% with YTD return 4.36%. The 1 YR return was 10.69%.
Data as of May 2012
REZ Top Ten Holdings & Weightings
- Public Storage (PSA): 9.83%
- Equity Residential (EQR): 9.71%
- Ventas Inc (VTR): 9.09%
- HCP Inc (HCP): 9.05%
- AvalonBay Communities Inc (AVB): 7.43%
- Essex Property Trust (ESS): 4.50%
- Health Care REIT, Inc. (HCN): 4.43%
- UDR Inc (UDR): 4.37%
- Camden Property Trust (CPT): 4.36%
- BRE Properties, Inc. (BRE): 3.26%
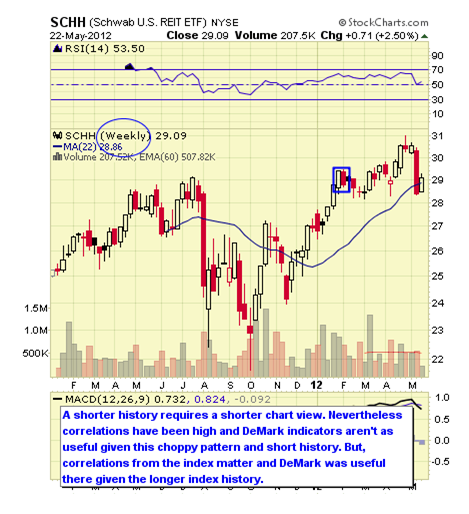
#8. Schwab U.S. REIT ETF SCHH
SCHH follows the Dow Jones U.S. Select REIT Index. The fund is quite new being launched in January 2011. The expense ratio is 0.13%. It should be noted that uniquely the ETF allows investors to trade this commission free for Schwab customers. A similar ETF was just launched by FocusShares (FRL) featuring a similar arrangement with Scottrade. AUM equal $329M and average daily trading volume is 112K shares.
As of May 2012 the current distribution dividend yield was 2.12% with YTD return 8.06%. The 1 YR return was 7.49%. SCHH trades commission free at Charles Schwab.
Data as of May 2012
SCHH Top Ten Holdings & Weightings
- Simon Property Group Inc (SPG): 11.85%
- Public Storage (PSA): 5.25%
- Equity Residential (EQR): 4.71%
- Ventas Inc (VTR): 4.40%
- HCP Inc (HCP): 4.38%
- Prologis Inc (PLD): 4.27%
- Vornado Realty Trust (VNO): 4.12%
- Boston Properties Inc (BXP): 4.10%
- AvalonBay Communities Inc (AVB): 3.60%
- Health Care REIT, Inc. (HCN): 3.10%
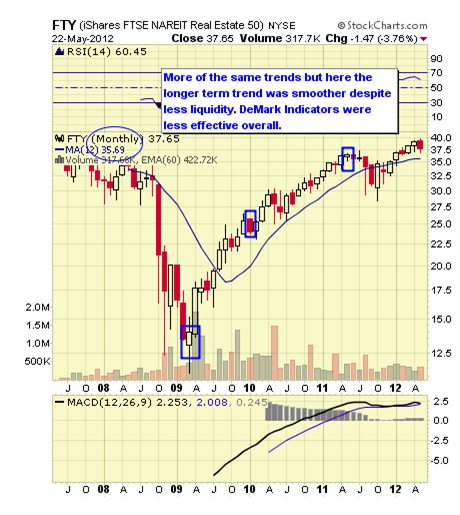
#7. iShares NARETI Real Estate 50 ETF FTY
FTY follows the FTSE NAREIT Real Estate 50 Index which measures the performance of the large cap real estate sector of the U.S. equity market. The fund was launched in May 2007. The expense ratio is 0.48%.
AUM equal $60.3M and average daily trading volume is 14K shares. As of early May 2012 the annual dividend yield was 2.90% and YTD return 6.51%. The 1 YR return was 5.93%.
Data as of May 2012
FTY Top Ten Holdings & Weightings
-
Simon Property Group Inc (SPG): 11.00%
-
American Tower Corp A (AMT): 6.18%
-
Public Storage (PSA): 4.34%
-
Equity Residential (EQR): 4.29%
-
Ventas Inc (VTR): 4.02%
-
HCP Inc (HCP): 4.00%
-
Prologis Inc (PLD): 3.90%
-
Boston Properties Inc (BXP): 3.79%
-
Vornado Realty Trust (VNO): 3.76%
-
Annaly Capital Management, Inc. (NLY): 3.75%
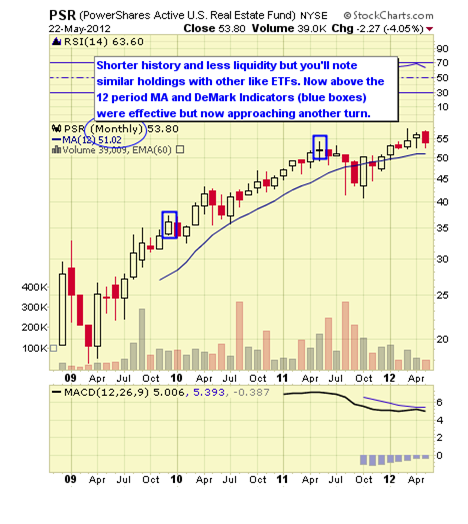
#6. PowerShares Active U.S. Real Estate ETF PSR
PSR actively manages the constituents found in the FTSE NAREIT All Equity REIT index. The selection methodology uses quantitative and statistical metrics to indentify attractively priced securities and manage risk. The fund was launched in November 2008. The expense ratio is 0.80%.
AUM equal $24 million and average daily trading volume is around less than 3K shares. As of May 2012 the annual dividend yield was 1.21% with YTD return 7.30%. The 1 YR return was 7.55%.
Data as of May 2012
PSR Top Ten Holdings & Weightings
-
Simon Property Group Inc (SPG): 9.88%
-
Prologis Inc (PLD): 6.42%
-
AvalonBay Communities Inc (AVB): 5.22%
-
American Tower Corp A (AMT): 4.80%
-
Host Hotels & Resorts Inc (HST): 4.51%
-
Ventas Inc (VTR): 4.20%
-
Public Storage (PSA): 3.04%
-
Kimco Realty Corp (KIM): 3.04%
-
Digital Realty Trust, Inc. (DLR): 3.02%
-
Macerich Company (MAC): 2.96%
#5. Vanguard REIT ETF VNQ

VNQ follows the MSCI US REIT Index which covers about 2/3 of all REITs in the U.S. market. The fund was launched in September 2004. The expense ratio is 0.12%. equal $12,036.8M with average daily trading volume 2M shares.
As of May 2012 the annual dividend yield was 3.43% with YTD return 8.71%. The 1 YR return was 8.05%. VNQ trades commission free at TD Ameritrade and Vanguard.
Data as of May 2012
VNQ Top Ten Holdings & Weightings
-
Simon Property Group Inc (SPG): 10.43%
-
Public Storage (PSA): 5.38%
-
Equity Residential (EQR): 4.66%
-
HCP Inc (HCP): 4.65%
-
Ventas Inc (VTR): 4.16%
-
Boston Properties Inc (BXP): 4.03%
-
ProLogis Inc (PLD): 3.62%
-
Vornado Realty Trust (VNO): 3.52%
-
AvalonBay Communities Inc (AVB): 3.38%
-
Host Hotels & Resorts Inc (HST): 2.87%
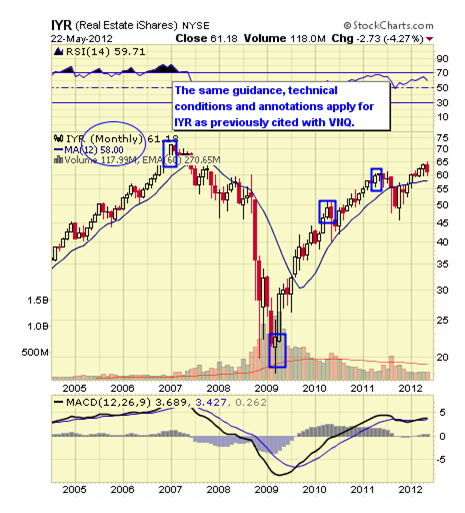
#4. iShares DJ U.S. Real Estate ETF IYR
IYR follows the Dow Jones U.S. Real Estate Index which measures the real estate industry primarily through REITs. The fund was launched in June 2000. The expense ratio is 0.48%. AUM equal nearly $3,6559M and average daily trading volume is 6M shares. As of May 2012 the annual dividend yield was 2.74% with YTD return 7.69%. The 1 YR return was 4.41%. IYR trades commission free at Fidelity.
For IYR and VNQ inverse and leveraged ETFs are available from Direxion Shares and ProShares which are linked to highly-correlated indexes.
Data as of May 2012
IYR Top Ten Holdings & Weightings
- Simon Property Group Inc (SPG): 9.32
- American Tower Corp A (AMT): 5.27%
- Public Storage (PSA): 4.13%
- Equity Residential (EQR): 3.70%
- Ventas Inc (VTR): 3.46%
- HCP Inc (HCP): 3.44%
- Prologis Inc (PLD): 3.36%
- Annaly Capital Management, Inc. (NLY): 3.24%
- Vornado Realty Trust (VNO): 3.24%
- Boston Properties Inc (BXP): 3.22%
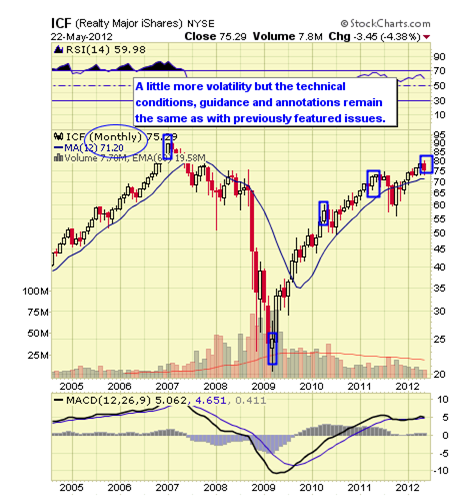
#3. iShares Cohen & Steers Major Real Estate ETF ICF
ICF follows the Cohen & Steers Realty Majors Index which consists of selected REITs. The fund was launched in January 2001. The expense ratio is 0.35%. AUM equal $2,790M and average daily trading volume is 466K shares.
As of May 2012 the annual dividend yield was 2.14% with YTD return 7.22%. The 1 YR return was 6.50%.
Data as of May 2012
ICF Top Ten Holdings & Weightings
- Simon Property Group Inc (SPG): 8.63%
- Public Storage (PSA): 7.23%
- Equity Residential (EQR): 6.48%
- Ventas Inc (VTR): 6.02%
- HCP Inc (HCP): 6.01%
- Prologis Inc (PLD): 5.80%
- Boston Properties Inc (BXP): 5.66%
- Vornado Realty Trust (VNO): 5.61%
- AvalonBay Communities Inc (AVB): 4.92%
- Health Care REIT, Inc. (HCN): 4.19%
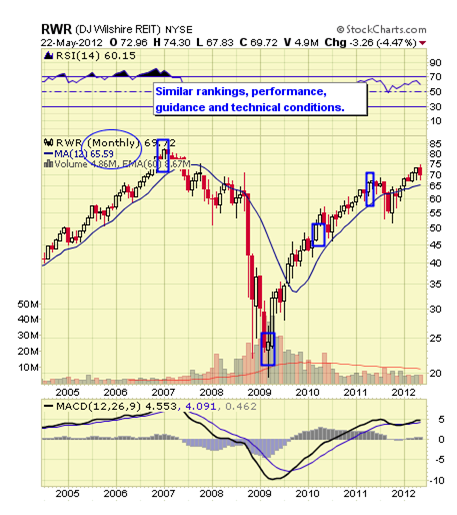
#2. SPDR DJ Wilshire REIT ETF RWR
RWR follows the Dow Jones U.S. Select REIT Index consists primarily of REITs in commercial real estate. The fund was launched in April 2001. The expense ratio is 0.25%. AUM equal $1,883M and average daily trading volume is 233K shares. As of May 2012 the annual dividend yield was 2.34% with YTD return 8.26%.
The 1 YR return was 7.64%. RWR trades commission free at TD Ameritrade.
Data as of May 2012
RWR Top Ten Holdings & Weightings
-
Simon Property Group Inc (SPG): 11.85%
-
Public Storage (PSA): 5.25%
-
Equity Residential (EQR): 4.71%
-
Ventas Inc (VTR): 4.40%
-
HCP Inc (HCP): 4.38%
-
Prologis Inc (PLD): 4.27%
-
Vornado Realty Trust (VNO): 4.11%
-
Boston Properties Inc (BXP): 4.10%
-
AvalonBay Communities Inc (AVB): 3.60%
-
Health Care REIT, Inc. (HCN): 3.10%
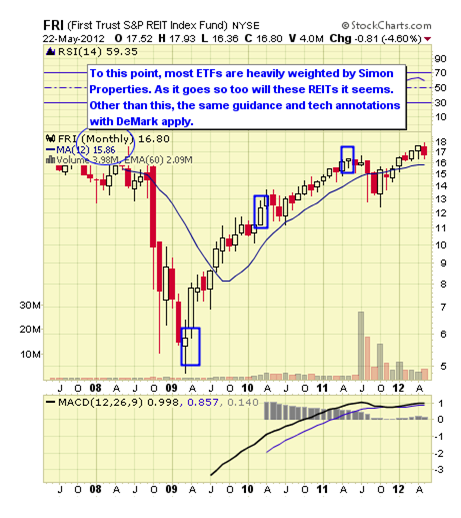
#1. First Trust REIT ETF FRI
FRI follows the S&P United States REIT Index measures the investable U.S. REIT market. The fund was launched in May 2007. The expense ratio is 0.50%. AUM are just under $426M and average daily trading volume is around 173K shares.
As of May 2012 the annual dividend yield was 2.03% with YTD return 8.46%. The 1 YR return was 7.17%.
Data as of May 2012
FRI Top Ten Holdings & Weightings
-
Simon Property Group Inc (SPG): 10.79%
-
Public Storage (PSA): 4.75%
-
Equity Residential (EQR): 4.55%
-
Prologis Inc (PLD): 4.00%
-
Ventas Inc (VTR): 3.99%
-
HCP Inc (HCP): 3.91%
-
Vornado Realty Trust (VNO): 3.77%
-
Boston Properties Inc (BXP): 3.77%
-
AvalonBay Communities Inc (AVB): 3.25%
-
Host Hotels & Resorts Inc (HST): 2.81%
We rank the top 10 ETF by our proprietary stars system as outlined below. However, given that we’re sorting these by both short and intermediate issues we have split the rankings as we move from one classification to another.
Strong established linked index
Excellent consistent performance and index tracking
Low fee structure
Strong portfolio suitability
Excellent liquidity

Established linked index even if “enhanced”
Good performance or more volatile if “enhanced” index
Average to higher fee structure
Good portfolio suitability or more active management if “enhanced” index
Decent liquidity


Enhanced or seasoned index
Less consistent performance and more volatile
Fees higher than average
Portfolio suitability would need more active trading
Average to below average liquidity


Index is new
Issue is new and needs seasoning
Fees are high
Portfolio suitability also needs seasoning
Liquidity below average


REITs have regained their popularity from investors seeking income. Some residential oriented REITs have done extremely well but some are suggesting owning versus renting is now becoming the more attractive alternative. It remains to be seen if this bears out over time. Remember many REIT structures allow for return of principal which may have negative tax consequences to unaware investors.
New ETFs from highly regarded and substantial new providers are also being issued. These may include Charles Schwab’s ETFs and Scottrade’s Focus Shares which both are issuing new ETFs with low expense ratios and commission free trading at their respective firms. These may also become popular as they become seasoned.
As stated with other sectors, remember ETF sponsors must issue and their interests aren’t aligned with yours. They have a business interest and wish to have a competitive presence in any popular sector.
For further information about portfolio structures using technical indicators like DeMark and other indicators see www.etfdigest.com. You may follow us on Facebook as well and join our group conversations.
You may address any feedback to: feedback@etfdigest.com
© 2024 Benzinga.com. Benzinga does not provide investment advice. All rights reserved.
Trade confidently with insights and alerts from analyst ratings, free reports and breaking news that affects the stocks you care about.

