Benzinga

España
Italia
대한민국
日本
Français
Benzinga Edge
Benzinga Research
Benzinga Pro

  • Get Benzinga Pro
  • Data & APIs
  • Events
  • Premarket
  • Advertise
Contribute
España
Italia
대한민국
日本
Français

Benzinga

  • Premium Services
  • Financial News
    Latest
    Earnings
    Guidance
    Dividends
    M&A
    Buybacks
    Interviews
    Management
    Offerings
    IPOs
    Insider Trades
    Biotech/FDA
    Politics
    Healthcare
    Small-Cap
  • Markets
    Pre-Market
    After Hours
    Movers
    ETFs
    Options
    Cryptocurrency
    Commodities
    Bonds
    Futures
    Mining
    Real Estate
    Volatility
  • Ratings
    Analyst Color
    Downgrades
    Upgrades
    Initiations
    Price Target
  • Investing Ideas
    Trade Ideas
    Long Ideas
    Short Ideas
    Technicals
    Analyst Ratings
    Analyst Color
    Latest Rumors
    Whisper Index
    Stock of the Day
    Best Stocks & ETFs
    Best Penny Stocks
    Best S&P 500 ETFs
    Best Swing Trade Stocks
    Best Blue Chip Stocks
    Best High-Volume Penny Stocks
    Best Small Cap ETFs
    Best Stocks to Day Trade
    Best REITs
  • Money
    Investing
    Cryptocurrency
    Mortgage
    Insurance
    Yield
    Personal Finance
    Forex
    Startup Investing
    Real Estate Investing
    Prop Trading
    Credit Cards
    Stock Brokers
Research
My Stocks
Tools
Free Benzinga Pro Trial
Calendars
Analyst Ratings Calendar
Conference Call Calendar
Dividend Calendar
Earnings Calendar
Economic Calendar
FDA Calendar
Guidance Calendar
IPO Calendar
M&A Calendar
Unusual Options Activity Calendar
SPAC Calendar
Stock Split Calendar
Trade Ideas
Free Stock Reports
Insider Trades
Trade Idea Feed
Analyst Ratings
Unusual Options Activity
Heatmaps
Free Newsletter
Government Trades
Perfect Stock Portfolio
Easy Income Portfolio
Short Interest
Most Shorted
Largest Increase
Largest Decrease
Calculators
Margin Calculator
Forex Profit Calculator
100x Options Profit Calculator
Screeners
Stock Screener
Top Momentum Stocks
Top Quality Stocks
Top Value Stocks
Top Growth Stocks
Compare Best Stocks
Best Momentum Stocks
Best Quality Stocks
Best Value Stocks
Best Growth Stocks
Connect With Us
facebookinstagramlinkedintwitteryoutubeblueskymastodon
About Benzinga
  • About Us
  • Careers
  • Advertise
  • Contact Us
Market Resources
  • Advanced Stock Screener Tools
  • Options Trading Chain Analysis
  • Comprehensive Earnings Calendar
  • Dividend Investor Calendar and Alerts
  • Economic Calendar and Market Events
  • IPO Calendar and New Listings
  • Market Outlook and Analysis
  • Wall Street Analyst Ratings and Targets
Trading Tools & Education
  • Benzinga Pro Trading Platform
  • Options Trading Strategies and News
  • Stock Market Trading Ideas and Analysis
  • Technical Analysis Charts and Indicators
  • Fundamental Analysis and Valuation
  • Day Trading Guides and Strategies
  • Live Investor Events
  • Pre-market Stock Analysis and News
  • Cryptocurrency Market Analysis and News
Ring the Bell

A newsletter built for market enthusiasts by market enthusiasts. Top stories, top movers, and trade ideas delivered to your inbox every weekday before and after the market closes.

  • Terms & Conditions
  • Do Not Sell My Personal Data/Privacy Policy
  • Disclaimer
  • Service Status
  • Sitemap
© 2026 Benzinga | All Rights Reserved
May 28, 2024 9:21 AM 3 min read

Gold Prices Edge Towards $2351 Amid Weakening US Dollar

by Andrey Goilov Benzinga Contributor
Follow

By RoboForex Analytical Department

Gold prices are on an upward trajectory, moving towards 2351.00 USD per troy ounce on Tuesday. This marks a significant rise after days of sideways movement, highlighting the metal's renewed appeal among investors.

This surge in gold prices can be attributed to a localised weakness in the US dollar, which has investors keenly anticipating the release of critical US inflation data later this week. The focus is particularly on the Core PCE indicator set for release on Friday, which is expected to provide further insights into the Federal Reserve's potential interest rate adjustments.

The market's reaction to the upcoming data could be pivotal, as strong movements in gold prices are likely once the Fed's intentions on rates become clearer. To date, discussions on rate adjustments have been vague, leaving investors craving more definitive guidance.

Despite the Fed's recent minutes suggesting a possibility of rate hikes due to persistent inflation, the market sentiment is tilted towards an eventual easing of the Fed's stance, as indicated by the positive direction of short-term futures contracts on gold.

Technical Analysis Of XAU/USD

Summary

Gold prices are rising due to a weaker US dollar and anticipation of key US inflation data. Technical indicators suggest potential corrections and further declines, with significant support and resistance levels to monitor. Investors should closely follow the upcoming data and Fed communications for additional market direction.

Disclaimer

Any forecasts contained herein are based on the author's particular opinion. This analysis may not be treated as trading advice. RoboForex bears no responsibility for trading results based on trading recommendations and reviews contained herein.

This article is from an unpaid external contributor. It does not represent Benzinga's reporting and has not been edited for content or accuracy.

Market News and Data brought to you by Benzinga APIs

© 2026 Benzinga.com. Benzinga does not provide investment advice. All rights reserved.

To add Benzinga News as your preferred source on Google, click here.


Posted In:
CommoditiesMarketsTrading IdeasGeneralcontributorsGold
Beat the Market With Our Free Pre-Market Newsletter
Enter your email to get Benzinga's ultimate morning update: The PreMarket Activity Newsletter

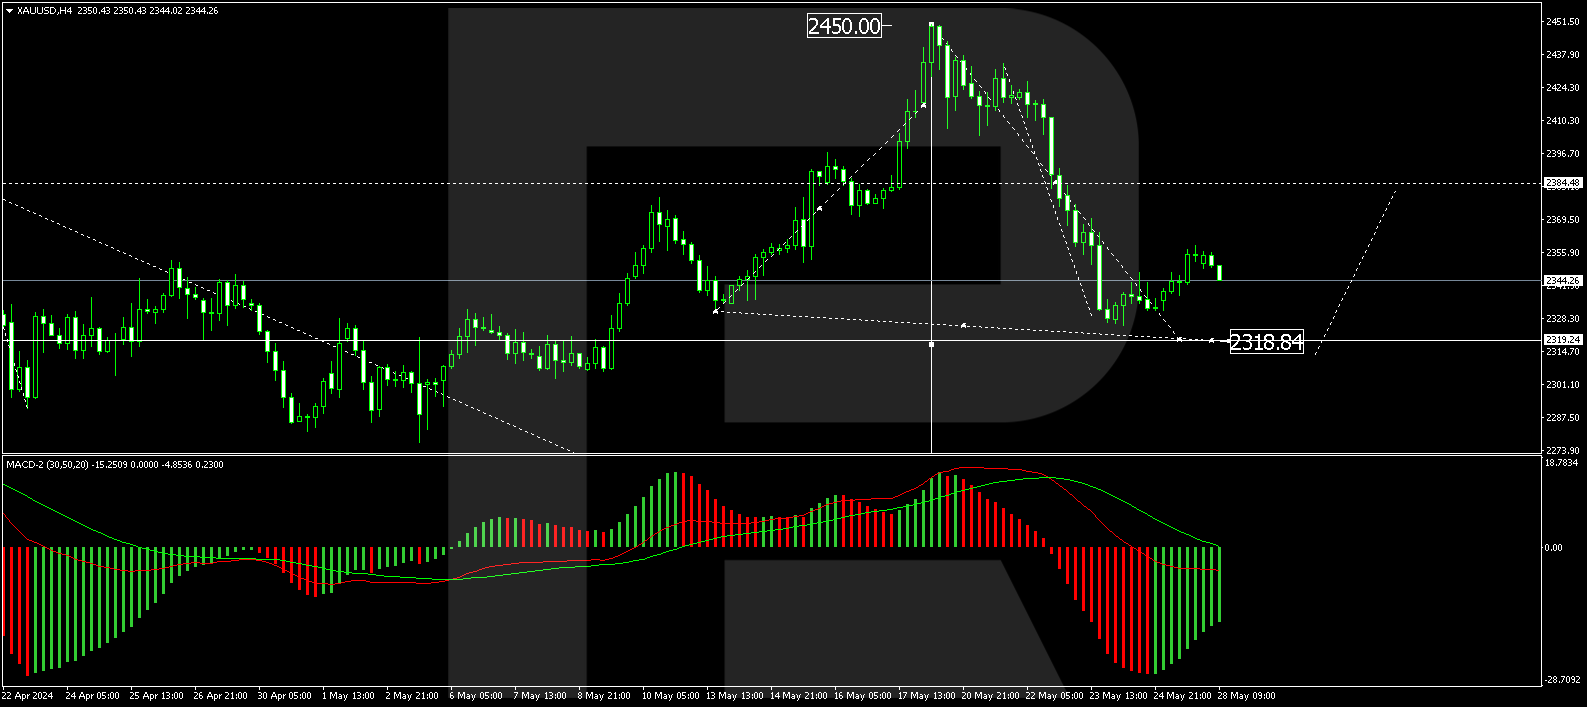
On the H4 chart of XAU/USD, a second downward impulse to the 2340.00 level has been formed. Today, a correction to 2358.50 has been executed. A downside movement to 2341.44 is expected, where a consolidation range may form. If the price breaks upwards from this range, a further correction towards 2384.80 could be considered. Conversely, a downward breakout could open the potential for a decline to 2318.80, the first target of the decline wave. This scenario is technically supported by the MACD indicator, with its signal line below zero and pointing strictly downwards towards new lows.

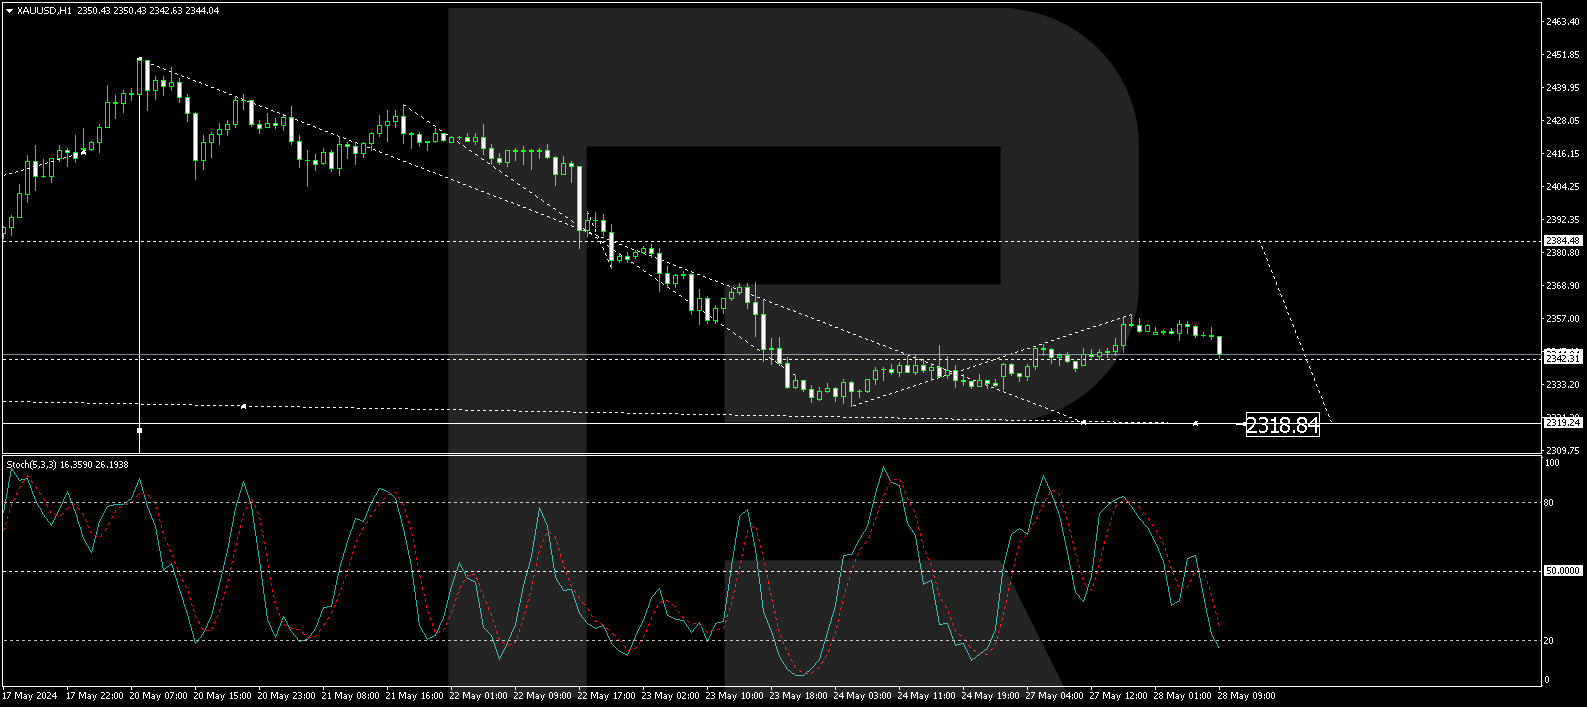
On the H1 chart, a decline to 2325.40 has been executed, followed by the formation of a growth structure to 2342.31. A consolidation range has formed around this level, with a correction wave to 2358.50, starting with an upward exit. Today, a decrease to 2342.31 (testing from above) has been executed. The new consolidation range is practically outlined. A downward breakout from this range could lead to another downward impulse to 2318.85. Further development towards 2384.50 is possible if the price breaks upwards, continuing the correction to 2384.85. Afterwards, a decline along the trend to 2318.85 is likely. This scenario is technically confirmed by the Stochastic oscillator, with its signal line having broken through 50 and continuing its decline to 20.

Comments
Loading...