
© 2026 Benzinga.com. Benzinga does not provide investment advice. All rights reserved.
To add Benzinga News as your preferred source on Google, click here.
Posted In:
© 2026 Benzinga.com. Benzinga does not provide investment advice. All rights reserved.
To add Benzinga News as your preferred source on Google, click here.
PASADENA, Calif., May 1, 2017 /PRNewswire/ -- Alexandria Real Estate Equities, Inc. (NYSE:ARE) announced financial and operating results for the first quarter ended March 31, 2017.
Key highlights
Addition to S&P 500 Index
We achieved another significant milestone with the announcement that the S&P Dow Jones Indices added Alexandria to the S&P 500® Index. This significant and important recognition reflects our best-in-class team's ability to successfully execute our differentiated business strategy, which drives our successful operating and financial performance.
Credit rating upgrade
S&P Global Ratings upgraded our corporate credit rating to BBB/Stable from BBB-/Positive.
Strong internal growth
|
1Q17 | |||
|
Total leasing activity – RSF |
1,320,781 | ||
|
Lease renewals and re-leasing of space: |
|||
|
Rental rate increases |
27.8% | ||
|
Rental rate increases (cash basis) |
17.7% | ||
|
RSF (included in total leasing activity above) |
878,863 | ||
Strong external growth; disciplined allocation of capital to visible, multiyear, highly leased value-creation pipeline
|
Delivery Date |
RSF |
Percentage Leased |
Incremental Annual Net Operating Income | ||||||
|
2016 |
1,893,928 |
94% |
$92 million (1) | ||||||
|
1Q17 |
272,612 |
100% |
$16 million | ||||||
|
2Q17–4Q17 |
1,132,505 |
78% |
$79 million to $89 million | ||||||
|
(1) Delivery of 2016 projects were primarily weighted toward 4Q16. | |||||||||
Increased common stock dividend
Common stock dividend for 1Q17 of $0.83 per common share, up 3 cents, or 4%, over 1Q16; continuation of our strategy to share growth in cash flows from operating activities with our stockholders while also retaining a significant portion for reinvestment.
Operating results
|
1Q17 |
1Q16 |
Change | ||||||||||
|
Net income (loss) attributable to Alexandria's common stockholders – diluted: |
||||||||||||
|
In millions |
$ |
25.7 |
$ |
(3.8) |
N/A |
|||||||
|
Per share |
$ |
0.29 |
$ |
(0.05) |
N/A |
|||||||
|
Funds from operations attributable to Alexandria's common stockholders – diluted, as adjusted: |
||||||||||||
|
In millions |
$ |
130.6 |
$ |
97.1 |
34.5 |
% |
||||||
|
Per share |
$ |
1.48 |
$ |
1.34 |
10.4 |
% |
||||||
|
Items included in net income (loss) attributable to Alexandria's common stockholders (amounts are shown after deducting any amounts attributable to noncontrolling interests): | |||||||||||||||
|
(In millions, except per share amounts) |
Amount |
Per Share – Diluted | |||||||||||||
|
1Q17 |
1Q16 |
1Q17 |
1Q16 | ||||||||||||
|
Impairment of real estate – Asia |
$ |
— |
$ |
(29.0) |
$ |
— |
$ |
(0.40) |
|||||||
|
Loss on early extinguishment of debt |
(0.7) |
— |
(0.01) |
— |
|||||||||||
|
Preferred stock redemption charge |
(11.3) |
(3.0) |
(0.12) |
(0.04) |
|||||||||||
|
Total |
$ |
(12.0) |
$ |
(32.0) |
$ |
(0.13) |
$ |
(0.44) |
|||||||
|
Weighted-average shares of common stock outstanding – diluted |
88.2 |
72.6 |
|||||||||||||
Core operating metrics and internal growth
External growth
Disciplined allocation of capital to visible, multiyear, highly leased value-creation pipeline
Disciplined management of development pipeline
Strategic acquisitions
Balance sheet management
Key capital events
Corporate social responsibility/thought leadership
Subsequent events in April 2017
Incremental Annual Net Operating Income from Development and Redevelopment of New Class A Properties
March 31, 2017

|
(1) |
Represents incremental annual net operating income upon stabilization of our development and redevelopment of new Class A properties, including only our share of real estate joint venture projects. RSF and percentage leased represent 100% of each property. |
|
(2) |
Delivery of 2016 projects were primarily weighted toward 4Q16. |
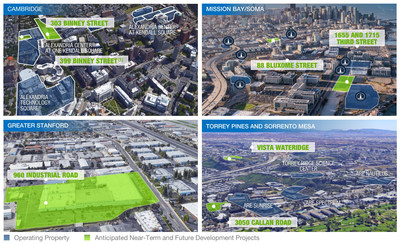
Acquisitions
March 31, 2017
(Dollars in thousands)
|
Submarket/Market |
Property |
Date of Purchase |
Number of Properties |
Square Footage |
Purchase Price |
|||||||||||||||||||
|
Operating |
Redevelopment |
Future Development |
Completed |
Pending |
||||||||||||||||||||
|
Cambridge/Greater Boston |
303 Binney Street (1) |
3/29/17 |
— |
— |
— |
208,965 |
$ |
80,250 |
$ |
— |
||||||||||||||
|
Mission Bay/SoMa/ |
88 Bluxome Street (2) |
1/10/17 |
1 |
232,470 |
— |
1,070,925 |
130,000 |
— |
||||||||||||||||
|
1655 and 1715 Third Street (3) |
1H18 |
— |
— |
— |
580,000 |
— |
35,000 |
|||||||||||||||||
|
Greater Stanford/San Francisco |
960 Industrial Road (4) |
2Q17 |
1 |
195,000 |
— |
500,000 |
— |
64,959 |
||||||||||||||||
|
Torrey Pines/Sorrento Mesa/ |
3050 Callan Road and |
3/24/17 |
— |
— |
— |
229,000 |
8,250 |
— |
||||||||||||||||
|
Research Triangle Park/RTP |
3054 East Cornwallis Road |
2Q17 |
1 |
— |
150,000 |
— |
— |
8,750 |
||||||||||||||||
|
Pending acquisition (5) |
2Q17 |
— |
— |
— |
500,000 |
— |
85,000 |
|||||||||||||||||
|
3 |
427,470 |
150,000 |
3,088,890 |
$ |
218,500 |
$ |
193,709 |
|||||||||||||||||
|
$412,209 |
||||||||||||||||||||||||
|
(1) |
Land parcels located adjacent to our Alexandria Center® at One Kendall Square campus that are currently entitled for the development of 163,339 RSF of office or office/laboratory space and 45,626 RSF of residential space. We may seek to increase the entitlements, which may result in additional purchase price consideration. |
|
(2) |
We are currently pursuing entitlements for the development of two buildings aggregating 1,070,925 RSF in two phases. The existing 232,470 RSF building is operating as a leading tennis and fitness facility. The future development square footage is inclusive of the current operating RSF. |
|
(3) |
Executed an agreement to purchase a 10% interest in a joint venture with Uber Technologies, Inc. ("Uber") and the Golden State Warriors. Our initial cash contribution of $35 million will be funded at closing of the joint venture in 2018. The joint venture will acquire land with completed below-grade improvements, building foundation and parking garage, and will complete vertical construction of two buildings aggregating 580,000 RSF, which will be leased to Uber. |
|
(4) |
Future ground-up development site with an operating component. We expect to pursue entitlements aggregating 500,000 RSF for a multi-building development. We anticipate leasing the existing property back to the seller on a short-term basis until we obtain entitlements. |
|
(5) |
Land parcel for the development of two buildings aggregating 500,000 RSF. Details of the pending acquisition will be disclosed in our 2Q17 Earnings Press Release and Supplemental Information. |
|
(1) |
172,500 SF redevelopment parcel acquired in November 2016 with the acquisition of Alexandria Center® at One Kendall Square. |
Guidance
March 31, 2017
(Dollars in millions, except per share amounts)
The following updated guidance is based on our current view of existing market conditions and assumptions for the year ending December 31, 2017. There can be no assurance that actual amounts will be materially higher or lower than these expectations. See our discussion of "forward-looking statements" on page 7 of this Earnings Press Release.
|
Summary of Key Changes in Guidance |
As of 5/1/17 |
As of 3/9/17 |
Summary of Key Changes in Guidance |
As of 5/1/17 |
As of 3/9/17 |
|||||||
|
EPS, FFO per share, and FFO per share, as adjusted |
See below |
See below |
Key sources and uses of capital |
See update below |
||||||||
|
Rental rate increases up 1% |
19.5% to 22.5% |
18.5% to 21.5% |
Same property NOI increase up 0.5% |
2.0% to 4.0% |
1.5% to 3.5% |
|||||||
|
Rental rate increases (cash basis) up 1% |
7.5% to 10.5% |
6.5% to 9.5% |
Capitalization of interest (1) |
$48 to $58 million |
$42 to $52 million |
|||||||
|
Earnings per Share and Funds From Operations per Share Attributable to Alexandria's |
|||||||
|
As of 5/1/17 |
As of 3/9/17 |
||||||
|
Earnings per share |
$1.43 to $1.53 |
$1.39 to $1.59 |
|||||
|
Depreciation and amortization |
4.45 |
4.45 |
|||||
|
Allocation to unvested restricted stock awards |
(0.04) |
(0.04) |
|||||
|
Funds from operations per share |
$5.84 to $5.94 |
$5.80 to $6.00 |
|||||
|
Add: loss on early extinguishment of debt |
0.01 |
0.01 |
|||||
|
Add: preferred stock redemption charge |
0.12 (2) |
0.09 |
|||||
|
Funds from operations per share, as adjusted |
$5.97 to $6.07 |
$5.90 to $6.10 |
|||||
|
Key Assumptions |
Low |
High |
|||||||
|
Occupancy percentage in North America as of December 31, 2017 |
96.6% |
97.2% |
|||||||
|
Lease renewals and re-leasing of space: |
|||||||||
|
Rental rate increases |
19.5% |
22.5% |
|||||||
|
Rental rate increases (cash basis) |
7.5% |
10.5% |
|||||||
|
Same property performance: |
|||||||||
|
Net operating income increase |
2.0% |
4.0% |
|||||||
|
Net operating income increase (cash basis) |
5.5% |
7.5% |
|||||||
|
Straight-line rent revenue |
$ |
107 |
$ |
112 |
|||||
|
General and administrative expenses |
$ |
68 |
$ |
73 |
|||||
|
Capitalization of interest (1) |
$ |
48 |
$ |
58 |
|||||
|
Interest expense |
$ |
131 |
$ |
141 |
|||||
|
Key Credit Metrics |
As of 5/1/17 |
||
|
Net debt to Adjusted EBITDA – 4Q17 annualized |
5.3x to 5.8x |
||
|
Net debt and preferred stock to Adjusted EBITDA – 4Q17 annualized |
5.3x to 5.8x |
||
|
Fixed-charge coverage ratio – 4Q17 annualized |
Greater than 4.0x |
||
|
Value-creation pipeline as a percentage of gross real estate as of |
Less than 10% |
|
Key Sources and Uses of Capital |
Range |
Midpoint |
|||||||||||
|
Sources of capital: |
|||||||||||||
|
Net cash provided by operating activities after dividends |
$ |
115 |
$ |
135 |
$ |
125 |
|||||||
|
Incremental debt |
300 |
280 |
290 |
||||||||||
|
Real estate dispositions and common equity |
970 |
1,240 |
1,105 |
(3)(4) |
|||||||||
|
Total sources of capital |
$ |
1,385 |
$ |
1,655 |
$ |
1,520 |
|||||||
|
Uses of capital: |
|||||||||||||
|
Construction |
$ |
815 |
$ |
915 |
$ |
865 |
|||||||
|
Acquisitions |
380 |
480 |
430 |
(4) |
|||||||||
|
7.00% Series D convertible preferred stock repurchases |
60 |
130 |
95 |
||||||||||
|
6.45% Series E redeemable preferred stock redemption |
130 |
130 |
130 |
||||||||||
|
Total uses of capital |
$ |
1,385 |
$ |
1,655 |
$ |
1,520 |
|||||||
|
Incremental debt (included above): |
|||||||||||||
|
Issuance of unsecured senior notes payable |
$ |
425 |
$ |
425 |
$ |
425 |
|||||||
|
Borrowings – secured construction loans |
200 |
250 |
225 |
||||||||||
|
Repayments of secured notes payable |
(5) |
(10) |
(8) |
||||||||||
|
Repayment of unsecured senior term loan |
(200) |
(200) |
(200) |
||||||||||
|
$1.65 billion unsecured senior line of credit/other |
(120) |
(185) |
(152) |
||||||||||
|
Incremental debt |
$ |
300 |
$ |
280 |
$ |
290 |
|||||||
|
(1) |
Increased from a range from $42 million to $52 million to a range from $48 million to $58 million to reflect capitalization of interest related to the completed and projected acquisitions of 303 Binney Street, 3054 East Cornwallis Road, 3050 Callan Road, Vista Wateridge, and a pending acquisition of a land parcel. See "Acquisitions" on page 4 of this Earnings Press Release for additional information. There was no change in our guidance for interest expense. |
|
(2) |
Includes charges aggregating $5.8 million related to the repurchases of 501,115 outstanding shares of our Series D Convertible Preferred Stock in 1Q17 and $5.5 million related to the redemption of our Series E Redeemable Preferred Stock in April 2017. Excludes any charges related to future repurchases of our Series D Convertible Preferred Stock. |
|
(3) |
Includes the public offering of 6.9 million shares of our common stock in March 2017, of which 4.8 million shares are subject to forward equity sales agreements, with anticipated aggregate net proceeds of $713.3 million, subject to adjustments as provided in the forward equity sales agreements. Also includes our share of the proceeds from the anticipated sale of a condominium interest in 203,090 RSF of our unconsolidated real estate joint venture property at 360 Longwood Avenue, aggregating approximately $65.7 million, pursuant to the exercise of a purchase option by the anchor tenant. The sale is expected to close in July 2017. |
|
(4) |
Increase since March 9, 2017, is related to the pending $85.0 million acquisition of a land parcel for the development of 500,000 RSF of new Class A properties. Also includes remaining purchase price of $56.8 million related to the acquisition of the remaining 49% interest in our unconsolidated real estate joint venture with Uber completed in November 2016. This amount will be paid in three equal installments in 2017, upon Uber's completion of construction milestones. See "Acquisitions" on page 4 of this Earnings Press Release for additional information. |
We will host a conference call on Tuesday, May 2, 2017, at 3:00 p.m. Eastern Time ("ET")/noon Pacific Time ("PT"), which is open to the general public to discuss our financial and operating results for the first quarter ended March 31, 2017. To participate in this conference call, dial (866) 524-3160 or (412) 317-6760 shortly before 3:00 p.m. ET/noon PT and ask the operator to join the Alexandria Real Estate Equities, Inc. call. The audio webcast can be accessed at www.are.com, in the "For Investors" section. A replay of the call will be available for a limited time from 5:00 p.m. ET/2:00 p.m. PT on Tuesday, May 2, 2017. The replay number is (877) 344-7529 or (412) 317-0088, and the confirmation code is 10102394.
Additionally, a copy of this Earnings Press Release and Supplemental Information for the first quarter ended March 31, 2017, is available in the "For Investors" section of our website at www.are.com or by following this link: http://www.are.com/fs/2017q1.pdf.
For any questions, please contact Joel S. Marcus, chairman, chief executive officer, and founder, at (626) 578-9693 or Dean A. Shigenaga, executive vice president, chief financial officer, and treasurer, at (626) 578-0777.
About the Company
Alexandria Real Estate Equities, Inc. (NYSE:ARE), an S&P 500® company, is an urban office real estate investment trust ("REIT") uniquely focused on collaborative life science and technology campuses in AAA innovation cluster locations, with a total market capitalization of $14.5 billion and an asset base in North America of 28.2 million square feet, as of March 31, 2017. The asset base in North America includes 20.1 million RSF of operating properties, including 1.6 million RSF of development and redevelopment of new Class A properties currently undergoing construction. Additionally, the asset base in North America includes 8.1 million SF of future development projects, including 1.5 million SF of near-term projects undergoing marketing for lease and preconstruction activities and 2.0 million SF of other near-term development projects. Founded in 1994, Alexandria pioneered this niche and has since established a significant market presence in key locations, including Greater Boston, San Francisco, New York City, San Diego, Seattle, Maryland, and Research Triangle Park. Alexandria has a longstanding and proven track record of developing Class A properties clustered in urban life science and technology campuses that provide its innovative tenants with highly dynamic and collaborative environments that enhance their ability to successfully recruit and retain world-class talent and inspire productivity, efficiency, creativity, and success. We believe these advantages result in higher occupancy levels, longer lease terms, higher rental income, higher returns, and greater long-term asset value. For additional information on Alexandria, please visit www.are.com.
***********
This document includes "forward-looking statements" within the meaning of Section 27A of the Securities Act of 1933, as amended, and Section 21E of the Securities Exchange Act of 1934, as amended. Such forward-looking statements include, without limitation, statements regarding our 2017 earnings per share attributable to Alexandria's common stockholders – diluted, 2017 funds from operations per share attributable to Alexandria's common stockholders – diluted, net operating income, and our projected sources and uses of capital. You can identify the forward-looking statements by their use of forward-looking words, such as "forecast," "guidance," "projects," "estimates," "anticipates," "believes," "expects," "intends," "may," "plans," "seeks," "should," or "will," or the negative of those words or similar words. These forward-looking statements are based on our current expectations, beliefs, projections, future plans and strategies, anticipated events or trends, and similar expressions concerning matters that are not historical facts, as well as a number of assumptions concerning future events. There can be no assurance that actual results will not be materially higher or lower than these expectations. These statements are subject to risks, uncertainties, assumptions, and other important factors that could cause actual results to differ materially from the results discussed in the forward-looking statements. Factors that might cause such a difference include, without limitation, our failure to obtain capital (debt, construction financing, and/or equity) or refinance debt maturities, increased interest rates and operating costs, adverse economic or real estate developments in our markets, our failure to successfully place into service and lease any properties undergoing development or redevelopment and our existing space held for future development or redevelopment (including new properties acquired for that purpose), our failure to successfully operate or lease acquired properties, decreased rental rates, increased vacancy rates or failure to renew or replace expiring leases, defaults on or non-renewal of leases by tenants, adverse general and local economic conditions, an unfavorable capital market environment, decreased leasing activity or lease renewals, and other risks and uncertainties detailed in our filings with the Securities and Exchange Commission ("SEC"). Accordingly, you are cautioned not to place undue reliance on such forward-looking statements. All forward-looking statements are made as of the date of this earnings press release, and unless otherwise stated, we assume no obligation to update this information and expressly disclaim any obligation to update or revise any forward-looking statements, whether as a result of new information, future events, or otherwise. For more discussion relating to risks and uncertainties that could cause actual results to differ materially from those anticipated in our forward-looking statements, and risks to our business in general, please refer to our SEC filings, including our most recent annual report on Form 10-K and any subsequent quarterly reports on Form 10-Q.
Consolidated Statements of Income
March 31, 2017
(In thousands, except per share amounts)
|
Three Months Ended | ||||||||||||||||||||
|
3/31/17 |
12/31/16 |
9/30/16 |
6/30/16 |
3/31/16 | ||||||||||||||||
|
Revenues: |
||||||||||||||||||||
|
Rental |
$ |
207,193 |
$ |
187,315 |
$ |
166,591 |
$ |
161,638 |
$ |
158,276 |
||||||||||
|
Tenant recoveries |
61,346 |
58,270 |
58,681 |
54,107 |
52,597 |
|||||||||||||||
|
Other income |
2,338 |
3,577 |
5,107 |
10,331 |
5,216 |
|||||||||||||||
|
Total revenues |
270,877 |
249,162 |
230,379 |
226,076 |
216,089 |
|||||||||||||||
|
Expenses: |
||||||||||||||||||||
|
Rental operations |
77,087 |
73,244 |
72,002 |
67,325 |
65,837 |
|||||||||||||||
|
General and administrative |
19,229 |
17,458 |
15,854 |
15,384 |
15,188 |
|||||||||||||||
|
Interest |
29,784 |
31,223 |
25,850 |
25,025 |
24,855 |
|||||||||||||||
|
Depreciation and amortization |
97,183 |
95,222 |
77,133 |
70,169 |
70,866 |
|||||||||||||||
|
Impairment of real estate |
— |
16,024 |
8,114 |
156,143 |
28,980 |
|||||||||||||||
|
Loss on early extinguishment of debt |
670 |
— |
3,230 |
— |
— |
|||||||||||||||
|
Total expenses |
223,953 |
233,171 |
202,183 |
334,046 |
205,726 |
|||||||||||||||
|
Equity in earnings (losses) of unconsolidated real estate joint ventures |
361 |
86 |
273 |
(146) |
(397) |
|||||||||||||||
|
Gain on sales of real estate – rental properties |
270 |
3,715 |
— |
— |
— |
|||||||||||||||
|
Income (loss) from continuing operations |
47,555 |
19,792 |
28,469 |
(108,116) |
9,966 |
|||||||||||||||
|
Gain on sales of real estate – land parcels |
— |
— |
90 |
— |
— |
|||||||||||||||
|
Net income (loss) |
47,555 |
19,792 |
28,559 |
(108,116) |
9,966 |
|||||||||||||||
|
Net income attributable to noncontrolling interests |
(5,844) |
(4,488) |
(4,084) |
(3,500) |
(4,030) |
|||||||||||||||
|
Net income (loss) attributable to Alexandria Real Estate Equities, Inc.'s |
41,711 |
15,304 |
24,475 |
(111,616) |
5,936 |
|||||||||||||||
|
Dividends on preferred stock |
(3,784) |
(3,835) |
(5,007) |
(5,474) |
(5,907) |
|||||||||||||||
|
Preferred stock redemption charge |
(11,279) |
(35,653) |
(13,095) |
(9,473) |
(3,046) |
|||||||||||||||
|
Net income attributable to unvested restricted stock awards |
(987) |
(943) |
(921) |
(1,085) |
(801) |
|||||||||||||||
|
Net income (loss) attributable to Alexandria Real Estate Equities, Inc.'s common |
$ |
25,661 |
$ |
(25,127) |
$ |
5,452 |
$ |
(127,648) |
$ |
(3,818) |
||||||||||
|
Net income (loss) per share attributable to Alexandria Real Estate Equities, Inc.'s common |
$ |
0.29 |
$ |
(0.31) |
$ |
0.07 |
$ |
(1.72) |
$ |
(0.05) |
||||||||||
|
Weighted-average shares of common stock outstanding: |
||||||||||||||||||||
|
Basic |
88,147 |
80,800 |
76,651 |
74,319 |
72,584 |
|||||||||||||||
|
Diluted |
88,200 |
80,800 |
77,402 |
74,319 |
72,584 |
|||||||||||||||
|
Dividends declared per share of common stock |
$ |
0.83 |
$ |
0.83 |
$ |
0.80 |
$ |
0.80 |
$ |
0.80 |
||||||||||
Consolidated Balance Sheets
March 31, 2017
(In thousands)
|
3/31/17 |
12/31/16 |
9/30/16 |
6/30/16 |
3/31/16 | ||||||||||||||||
|
Assets |
||||||||||||||||||||
|
Investments in real estate |
$ |
9,470,667 |
$ |
9,077,972 |
$ |
7,939,179 |
$ |
7,774,608 |
$ |
7,741,466 |
||||||||||
|
Investments in unconsolidated real estate joint ventures |
50,457 |
50,221 |
133,580 |
132,433 |
127,165 |
|||||||||||||||
|
Cash and cash equivalents |
151,209 |
125,032 |
157,928 |
256,000 |
146,197 |
|||||||||||||||
|
Restricted cash |
18,320 |
16,334 |
16,406 |
13,131 |
14,885 |
|||||||||||||||
|
Tenant receivables |
9,979 |
9,744 |
9,635 |
9,196 |
9,979 |
|||||||||||||||
|
Deferred rent |
364,348 |
335,974 |
318,286 |
303,379 |
293,144 |
|||||||||||||||
|
Deferred leasing costs |
202,613 |
195,937 |
191,765 |
191,619 |
192,418 |
|||||||||||||||
|
Investments |
394,471 |
342,477 |
320,989 |
360,050 |
316,163 |
|||||||||||||||
|
Other assets |
206,562 |
201,197 |
206,133 |
104,414 |
130,115 |
|||||||||||||||
|
Total assets |
$ |
10,868,626 |
$ |
10,354,888 |
$ |
9,293,901 |
$ |
9,144,830 |
$ |
8,971,532 |
||||||||||
|
Liabilities, Noncontrolling Interests, and Equity |
||||||||||||||||||||
|
Secured notes payable |
$ |
1,083,758 |
$ |
1,011,292 |
$ |
789,450 |
$ |
722,794 |
$ |
816,578 |
||||||||||
|
Unsecured senior notes payable |
2,799,508 |
2,378,262 |
2,377,482 |
2,376,713 |
2,031,284 |
|||||||||||||||
|
Unsecured senior line of credit |
— |
28,000 |
416,000 |
72,000 |
299,000 |
|||||||||||||||
|
Unsecured senior bank term loans |
547,420 |
746,471 |
746,162 |
945,030 |
944,637 |
|||||||||||||||
|
Accounts payable, accrued expenses, and tenant security deposits |
782,637 |
731,671 |
605,181 |
593,628 |
628,467 |
|||||||||||||||
|
Dividends payable |
78,976 |
76,914 |
66,705 |
67,188 |
64,275 |
|||||||||||||||
|
Preferred stock redemption liability |
130,000 |
— |
— |
— |
— |
|||||||||||||||
|
Total liabilities |
5,422,299 |
4,972,610 |
5,000,980 |
4,777,353 |
4,784,241 |
|||||||||||||||
|
Commitments and contingencies |
||||||||||||||||||||
|
Redeemable noncontrolling interests |
11,320 |
11,307 |
9,012 |
9,218 |
14,218 |
|||||||||||||||
|
Alexandria Real Estate Equities, Inc.'s stockholders' equity: |
||||||||||||||||||||
|
7.00% Series D cumulative convertible preferred stock |
74,386 |
86,914 |
161,792 |
188,864 |
213,864 |
|||||||||||||||
|
6.45% Series E cumulative redeemable preferred stock |
— |
130,000 |
130,000 |
130,000 |
130,000 |
|||||||||||||||
|
Common stock |
899 |
877 |
768 |
766 |
729 |
|||||||||||||||
|
Additional paid-in capital |
4,855,686 |
4,672,650 |
3,649,263 |
3,693,807 |
3,529,660 |
|||||||||||||||
|
Accumulated other comprehensive income (loss) |
21,460 |
5,355 |
(31,745) |
8,272 |
(8,533) |
|||||||||||||||
|
Alexandria Real Estate Equities, Inc.'s stockholders' equity |
4,952,431 |
4,895,796 |
3,910,078 |
4,021,709 |
3,865,720 |
|||||||||||||||
|
Noncontrolling interests |
482,576 |
475,175 |
373,831 |
336,550 |
307,353 |
|||||||||||||||
|
Total equity |
5,435,007 |
5,370,971 |
4,283,909 |
4,358,259 |
4,173,073 |
|||||||||||||||
|
Total liabilities, noncontrolling interests, and equity |
$ |
10,868,626 |
$ |
10,354,888 |
$ |
9,293,901 |
$ |
9,144,830 |
$ |
8,971,532 |
||||||||||
Funds From Operations and Funds From Operations per Share
March 31, 2017
(In thousands, except per share amounts)
The following tables present a reconciliation of net income (loss) attributable to Alexandria's common stockholders – basic, the most directly comparable financial measure presented in accordance with generally accepted accounting principles ("GAAP"), including our share of amounts from consolidated and unconsolidated real estate joint ventures, to funds from operations attributable to Alexandria's common stockholders – diluted, and funds from operations attributable to Alexandria's common stockholders – diluted, as adjusted, and related per share amounts. Amounts allocable to unvested restricted stock awards are not material and are not presented separately within the per share table below. Per share amounts may not add due to rounding.
|
Three Months Ended | ||||||||||||||||||||
|
3/31/17 |
12/31/16 |
9/30/16 |
6/30/16 |
3/31/16 | ||||||||||||||||
|
Net income (loss) attributable to Alexandria's common stockholders |
$ |
25,661 |
$ |
(25,127) |
$ |
5,452 |
$ |
(127,648) |
$ |
(3,818) |
||||||||||
|
Depreciation and amortization |
97,183 |
95,222 |
77,133 |
70,169 |
70,866 |
|||||||||||||||
|
Noncontrolling share of depreciation and amortization from consolidated real estate JVs |
(3,642) |
(2,598) |
(2,224) |
(2,226) |
(2,301) |
|||||||||||||||
|
Our share of depreciation and amortization from unconsolidated real estate JVs |
412 |
655 |
658 |
651 |
743 |
|||||||||||||||
|
Gain on sales of real estate – rental properties |
(270) |
(3,715) |
— |
— |
— |
|||||||||||||||
|
Gain on sales of real estate – land parcels |
— |
— |
(90) |
— |
— |
|||||||||||||||
|
Impairment of real estate – rental properties |
— |
3,506 |
6,293 |
88,395 |
— |
|||||||||||||||
|
Allocation to unvested restricted stock awards |
(561) |
— |
(438) |
— |
(80) |
|||||||||||||||
|
Funds from operations attributable to Alexandria's common stockholders – basic and diluted (1) |
118,783 |
67,943 |
86,784 |
29,341 |
65,410 |
|||||||||||||||
|
Non-real estate investment income |
— |
— |
— |
(4,361) |
— |
|||||||||||||||
|
Impairment of land parcels and non-real estate investments |
— |
12,511 |
4,886 |
67,162 |
28,980 |
|||||||||||||||
|
Loss on early extinguishment of debt |
670 |
— |
3,230 |
— |
— |
|||||||||||||||
|
Preferred stock redemption charge |
11,279 |
35,653 |
13,095 |
9,473 |
3,046 |
|||||||||||||||
|
Allocation to unvested restricted stock awards |
(150) |
(605) |
(359) |
(530) |
(358) |
|||||||||||||||
|
Funds from operations attributable to Alexandria's common stockholders – diluted, as adjusted |
$ |
130,582 |
$ |
115,502 |
$ |
107,636 |
$ |
101,085 |
$ |
97,078 |
||||||||||
|
Net income (loss) per share attributable to Alexandria's common stockholders |
$ |
0.29 |
$ |
(0.31) |
$ |
0.07 |
$ |
(1.72) |
$ |
(0.05) |
||||||||||
|
Depreciation and amortization |
1.06 |
1.15 |
0.97 |
0.92 |
0.95 |
|||||||||||||||
|
Gain on sales of real estate – rental properties |
— |
(0.05) |
— |
— |
— |
|||||||||||||||
|
Impairment of real estate – rental properties |
— |
0.05 |
0.08 |
1.19 |
— |
|||||||||||||||
|
Funds from operations per share attributable to Alexandria's common stockholders – |
1.35 |
0.84 |
1.12 |
0.39 |
0.90 |
|||||||||||||||
|
Non-real estate investment income |
— |
— |
— |
(0.06) |
— |
|||||||||||||||
|
Impairment of land parcels and non-real estate investments |
— |
0.15 |
0.06 |
0.90 |
0.40 |
|||||||||||||||
|
Loss on early extinguishment of debt |
0.01 |
— |
0.04 |
— |
— |
|||||||||||||||
|
Preferred stock redemption charge |
0.12 |
0.43 |
0.17 |
0.13 |
0.04 |
|||||||||||||||
|
Funds from operations per share attributable to Alexandria's common stockholders – |
$ |
1.48 |
$ |
1.42 |
$ |
1.39 |
$ |
1.36 |
$ |
1.34 |
||||||||||
|
Weighted-average shares of common stock outstanding for calculating funds from operations per share and |
88,200 |
81,280 |
77,402 |
74,319 |
72,584 |
|||||||||||||||
|
(1) |
Calculated in accordance with standards established by the Advisory Board of Governors of the National Association of Real Estate Investment Trusts (the "NAREIT Board of Governors") in its April 2002 White Paper and related implementation guidance. |
To view the original version on PR Newswire, visit:http://www.prnewswire.com/news-releases/alexandria-real-estate-equities-inc-reports-first-quarter-ended-march-31-2017-financial-and-operating-results-strong-internal-and-external-growth-300448905.html
SOURCE Alexandria Real Estate Equities, Inc.


