


Approaching Tactical Bounces In Bear Markets
During market corrections, correlations tend to go to one across asset classes, but more specifically global equity markets tend to move together. Throughout the global equity markets and U.S. sectors I follow, many tactical downside targets were met with momentum diverging positively, suggesting a relief-rally may occur over the next few weeks. Many of these markets followed up their mid-week reversals with follow through to end the week, which adds to the case for additional upside over the short-term. It’s important to realize though that most of these moves are occurring within the context of structural downtrends / bear markets, which means this bounce is just that for the time being. Significantly more time will be needed to repair the long-term structural damage these markets have experienced.
How you approach this type of scenario will depend on your plan as a market participant, but for me it really boils down to two main scenarios. Either you can choose to take tactical long positions to capitalize on these bounces, or you can simply wait for them to play out and re-enter on the short side at higher levels. Some people will do both, others may do something different altogether.
If you’re looking to participate in these counter-trend rallies, how do you figure out what’s the best way to express the theme of counter-trend rallies occurring throughout the global equity markets when almost everything seems to participate in one capacity or another?
I’m sure there are a million schools of thought on this, but for me, I like to look for stocks / sectors / markets where the risk is well defined and the weight of evidence suggests that the probability of a bounce is high, relative to the other setups out there. I find that this occurs most often in names that have found support at levels where both structural and tactical downside targets were hit, with momentum diverging on multiple time frames. This means often passing on the more beaten down sectors where mean reversion could occur in rip-your-face-off fashion, in favor of a trade where the weight of evidence suggests there is a higher probability of success, but less potential reward. Some may be comfortable taking the lower probability trade in exchange for a higher potential reward, but I tend to lean toward what I view as higher probability trades.
To illustrate exactly what I’m talking about, I’ll outline an example of each from the current market environment. I’ll also list a few other names I’m watching / doing more work on toward the end of the post, but won’t post the charts of them here for the sake of space.

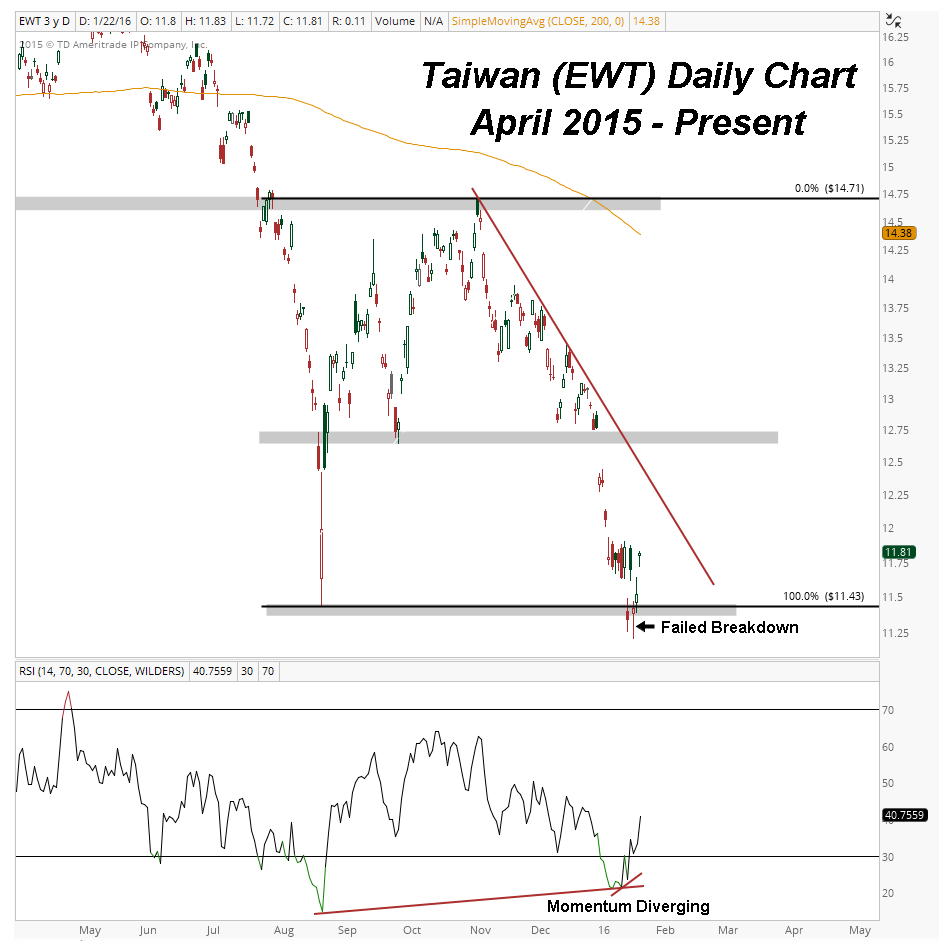
The daily chart shows the failed breakdown below the August lows, which also corresponds with the long-term support discussed on the weekly chart. Momentum diverged at the recent lows with prices breaking back above the prior lows to confirm the failed breakdown and momentum divergence. This provides a level to trade against where the risk is well-defined, while the rest of the evidence suggests mean reversion may be underway in this market.
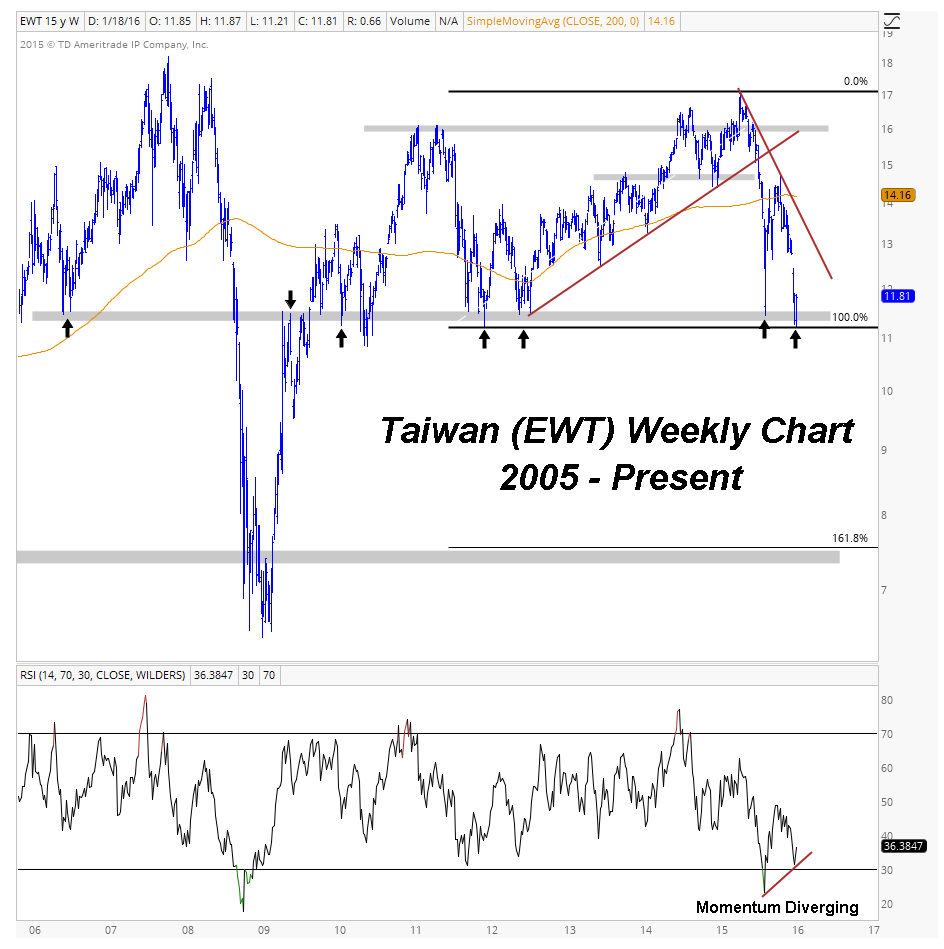
In the case of Taiwan, there is strong evidence across multiple time-frames that suggests a counter-trend mean reversion is taking place and that the risk is well-defined. Prices are 22% below the 200 day moving average, and though prices won’t get there in a straight line, a calculated entry can provide a great risk/reward opportunity on the long side.
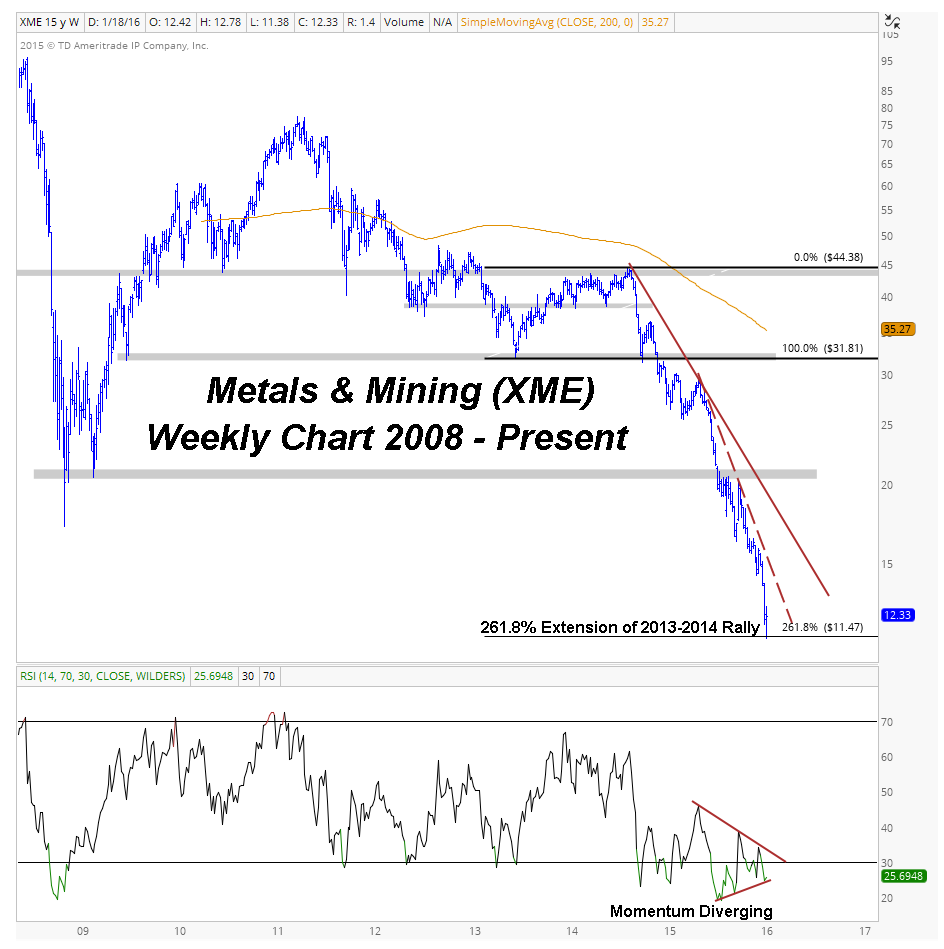
Lower Probability But Higher Potential Reward: S&P Metals & Mining (XME)
The S&P Metals & Mining ETF has been in a structural downtrend for the past 5 years or so, and just this past week reached another structural downside target at the 261.8% Fibonacci extension of the 2013-2014 rally. This occurred while momentum diverged and prices were extended from their accelerated trend lines. These developments may suggest that some mean reversion could start from current levels, but it must also be recognized that this comes within the context of prices being just off their all-time lows.
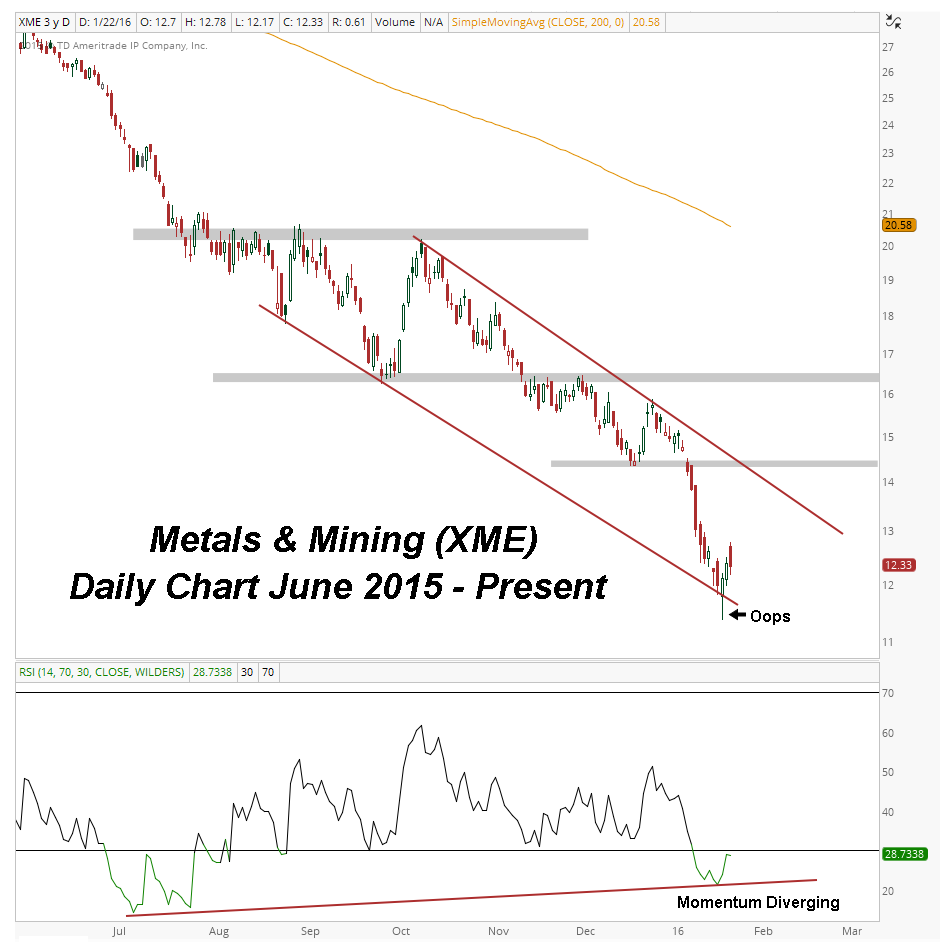
The daily chart shows the failed breakdown that occurred late last week with momentum diverging. This combined with the developments on the weekly chart provide a clear level to trade against. Prices are 67% below their 200 day moving average and this sector is heavily shorted, so a short squeeze could occur in the coming weeks if this failed breakdown holds. Although the potential reward is higher, it comes within the context of having less evidence / a lower probability than a setup like the one I discussed in Taiwan (EWT).
Other markets that are exhibiting similar characteristics to Taiwan in varying degrees are:
Micro-caps (IWC), S&P Oil & Gas Exploration & Production (XOP), Airlines (XAL), Broker Dealers (IAI), Emerging Markets (EEM), Hong Kong (EWH), China Large-Cap (FXI), Russia (RSX), Chile (ECH), South Africa (EZA), and Netherlands (EWN).
The Bottom Line: There’s no right or wrong way to approach bounces during bear markets, but it is important to have a plan with which you approach trading counter-trend rallies when they do occur. When these types of market conditions are present, this approach is generally how I help narrow down my thoughts on which areas of the market I’d like to focus my efforts and capital. It should also be noted that this represents the middle phase of my Top-Down Approach, and that the information I gather from this type of analysis may be expressed in a way that’s different than simply trading the underlying asset class outright. That’s a conversation for another day / post though.
As always, if you have any questions feel free to reach out and I’ll get back to you as soon as I can. @Brunicharting
© 2024 Benzinga.com. Benzinga does not provide investment advice. All rights reserved.
Trade confidently with insights and alerts from analyst ratings, free reports and breaking news that affects the stocks you care about.

