


Alexandria Real Estate Equities, Inc. Reports Second Quarter Ended June 30, 2018, Financial and Operating Results Strong Internal and External Growth, Operational Excellence and Growing Dividends
PR Newswire
PASADENA, Calif., July 30, 2018
PASADENA, Calif., July 30, 2018 /PRNewswire/ -- Alexandria Real Estate Equities, Inc. ARE announced financial and operating results for the second quarter ended June 30, 2018.
Key highlights
Increased common stock dividend
Common stock dividend for 2Q18 of $0.93 per common share, up 7 cents, or 8.1%, over 2Q17; continuation of our strategy to share growth in cash flows from operating activities with our stockholders while also retaining a significant portion for reinvestment.
Strong internal growth
- Total revenues:
- $325.0 million, up 19.0%, for 2Q18, compared to $273.1 million for 2Q17
- $645.2 million, up 18.6%, for 1H18, compared to $543.9 million for 1H17
- Net operating income (cash basis) of $818.7 million for 2Q18 annualized, up $60.4 million, or 8.0%, compared to 1Q18 annualized, and up $125.5 million, or 18.1%, compared to 4Q17 annualized
- Same property net operating income growth:
- 4.1% and 6.3% (cash basis) for 2Q18, compared to 2Q17
- 4.1% and 10.3% (cash basis) for 1H18, compared to 1H17
- Continued solid leasing activity and strong rental rate growth, in light of modest contractual lease expirations at the beginning of 2018 and a highly leased value-creation pipeline:
|
2Q18 |
1H18 | |||||
|
Total leasing activity – RSF |
985,996 |
2,467,160 | ||||
|
Lease renewals and re-leasing of space: |
||||||
|
Rental rate increases |
24.0% |
21.5% | ||||
|
Rental rate increases (cash basis) |
12.8% |
13.8% | ||||
|
RSF (included in total leasing activity above) |
727,265 |
961,813 | ||||
- Key leases executed during 2Q18 (included in total leasing activity above):
|
Property |
Submarket |
RSF |
Tenant | ||||
|
215 First Street |
Cambridge |
152,157 |
(1) |
Sarepta Therapeutics, Inc. | |||
|
960 Industrial Road |
Greater Stanford |
110,000 |
(2) |
Joby Aero, Inc. | |||
|
1201 Eastlake Avenue East |
Lake Union |
106,106 |
(3) |
Fred Hutchinson Cancer | |||
|
Alexandria Center® at One |
Cambridge |
69,512 |
(4) |
Ipsen Bioscience, Inc. | |||
|
950 Wind River Lane |
Gaithersburg |
50,000 |
AstraZeneca PLC | ||||
|
(1) |
Includes 121,476 RSF renewed/re-leased at rental rate increases of 53% and 36% (cash basis) and expansion of 30,681 RSF. 88,459 RSF represents early renewal of a lease expiration in January 2021. |
|
(2) |
Represents short-term lease for 110,000 RSF. The property also includes an additional 423,000 RSF undergoing entitlements for future development in one or two phases. |
|
(3) |
Re-leasing of space with a lease expiration in May 2019 at a rental rate increase of 35%. |
|
(4) |
Re-leasing of space with a lease expiration in June 2019 at rental rate increases of 16% and 49% (cash). |
Strong external growth; disciplined allocation of capital to visible, multiyear, highly leased value-creation pipeline
- Highly leased value-creation pipeline with deliveries targeted for 2018 and 2019:
|
Property Leased % |
Unlevered Yields | ||||||||
|
Target Delivery |
Initial Stabilized |
Initial Stabilized (Cash) | |||||||
|
2018 |
501,325 |
RSF |
75% |
7.5% |
7.0% | ||||
|
2019 |
2,110,831 |
RSF |
86% |
7.3% |
6.7% | ||||
|
2,612,156 |
RSF |
84% |
7.3% |
6.8% | |||||
- Includes 2Q18 commencement of vertical construction of a ground-up development project aggregating 205,000 RSF, 12% leased and 12% negotiating, at 1818 Fairview Avenue East in our Lake Union submarket.
- New Class A development and redevelopment properties recently placed into service
- 1.6 million RSF placed into service during the last 12 months with average yields of 7.6% and 7.1% (cash).
Recent and future growth in net operating income (cash basis) driven by recently delivered projects:
- Significant near-term contractual growth in annual cash rents of $44 million related to initial free rent granted on development and redevelopment projects recently placed into service (and no longer included in our value-creation pipeline) that are currently generating rental revenue.
Completed strategic acquisitions
Acquisitions completed:
- In 2Q18 and July 2018, we acquired 14 properties and four land parcels for an aggregate purchase price of $662.9 million in key submarkets. These acquisitions consisted of:
- Two properties and four land parcels supporting the future development of new Class A buildings aggregating 1,010,000 RSF;
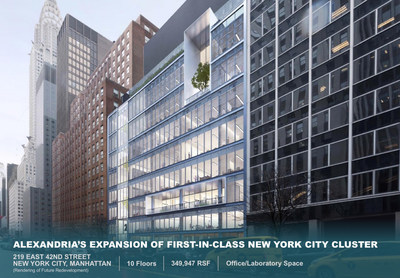
- 389,452 RSF of value-add operating properties with future redevelopment opportunities, including $203.0 million for a fee simple interest in an office building aggregating 349,947 RSF located in New York City, which is currently occupied by Pfizer Inc.; and
- 828,014 RSF of 99% occupied operating properties, including significant below-market leases.
Operating results
|
2Q18 |
2Q17 |
1H18 |
1H17 | ||||||||||||
|
Net income attributable to Alexandria's common stockholders – diluted: | |||||||||||||||
|
In millions |
$ |
52.0 |
$ |
31.6 |
$ |
185.0 |
$ |
57.3 |
|||||||
|
Per share |
$ |
0.51 |
$ |
0.35 |
$ |
1.83 |
$ |
0.64 |
|||||||
|
Funds from operations attributable to Alexandria's common stockholders – diluted, as adjusted: | |||||||||||||||
|
In millions |
$ |
167.9 |
$ |
136.2 |
$ |
330.4 |
$ |
266.7 |
|||||||
|
Per share |
$ |
1.64 |
$ |
1.50 |
$ |
3.27 |
$ |
2.98 |
|||||||
|
See "Items Included in Net Income Attributable to Alexandria's Common Stockholders" below for additional information. | |||||||||||||||
|
Items included in net income attributable to Alexandria's common stockholders: | |||||||||||||||||||||||||||||||
|
(In millions, except per share amounts) |
Amount |
Per Share – Diluted |
Amount |
Per Share – Diluted | |||||||||||||||||||||||||||
|
2Q18 |
2Q17 |
2Q18 |
2Q17 |
1H18 |
1H17 |
1H18 |
1H17 | ||||||||||||||||||||||||
|
Realized gain on non-real estate |
$ |
— |
$ |
— |
$ |
— |
$ |
— |
$ |
8.3 |
$ |
— |
$ |
0.08 |
$ |
— | |||||||||||||||
|
Unrealized gains on non-real estate |
5.1 |
— |
0.05 |
— |
77.3 |
— |
0.76 |
— | |||||||||||||||||||||||
|
Gain on sales of real estate |
— |
0.1 |
— |
— |
— |
0.4 |
— |
— | |||||||||||||||||||||||
|
Impairment of: |
|||||||||||||||||||||||||||||||
|
Real estate |
(6.3) |
(0.2) |
(0.06) |
— |
(6.3) |
(0.2) |
(0.06) |
— | |||||||||||||||||||||||
|
Non-real estate investments |
— |
(4.5) |
— |
(0.05) |
— |
(4.5) |
— |
(0.05) | |||||||||||||||||||||||
|
Loss on early extinguishment of debt |
— |
— |
— |
— |
— |
(0.7) |
— |
(0.01) | |||||||||||||||||||||||
|
Preferred stock redemption charge |
— |
— |
— |
— |
— |
(11.3) |
— |
(0.12) | |||||||||||||||||||||||
|
Total |
$ |
(1.2) |
$ |
(4.6) |
$ |
(0.01) |
$ |
(0.05) |
$ |
79.3 |
$ |
(16.3) |
$ |
0.78 |
$ |
(0.18) | |||||||||||||||
|
Weighted-average shares of common stock |
102.2 |
90.7 |
101.2 |
89.5 | |||||||||||||||||||||||||||
|
(1) See "Investments" on page 46 of our Supplemental Information for additional information. | |||||||||||||||||||||||||||||||
Core operating metrics as of or for the quarter ended June 30, 2018
High-quality revenues and cash flows and operational excellence
- Percentage of annual rental revenue in effect from:
- Investment-grade or large cap tenants: 55%
- Class A properties in AAA locations: 78%
- Occupancy of operating properties in North America: 97.1%
- Operating margin: 72%
- Adjusted EBITDA margin: 69%
- Weighted-average remaining lease term:
- Total tenants: 8.6 years
- Top 20 tenants: 12.8 years
- See "Strong Internal Growth" on the previous page for information on our total revenues, same property net operating income growth, leasing activity, and rental rate growth.
Balance sheet management
Key metrics
- $18.8 billion of total market capitalization as of June 30, 2018
- $2.9 billion of liquidity as of June 30, 2018
|
2Q18 |
||||||
|
Quarter |
Trailing 12 |
4Q18 | ||||
|
Annualized |
Months |
Goal | ||||
|
Net debt to Adjusted EBITDA |
5.8x |
6.2x |
Less than 5.5x | |||
|
Fixed-charge coverage ratio |
4.3x |
4.3x |
Greater than 4.0x | |||
|
Unhedged variable-rate debt as a percentage of |
5% |
N/A |
Less than 5% | |||
|
Current and future value-creation pipeline as a |
10% |
N/A |
8% to 12% | |||
Key capital events
- In June 2018, we completed an offering of $900.0 million of unsecured senior notes for net proceeds of $891.4 million. The unsecured senior notes consisted of:
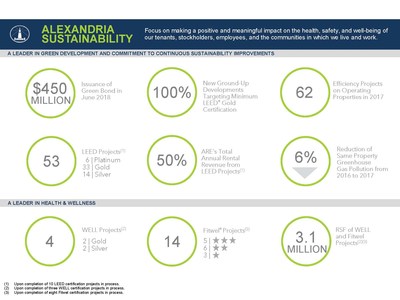
- $450.0 million of 4.00% unsecured senior notes, due in 2024. The net proceeds will be used to fund certain eligible green development and redevelopment projects that have received or are expected to receive LEED® Gold or Platinum certification.
- $450.0 million of 4.70% unsecured senior notes, due in 2030.
- During 2Q18, we sold 2.5 million shares of common stock under our at-the-market common stock offering program ("ATM program") for $124.46 per share and received net proceeds of $300.8 million. In July 2018, we sold 703,625 shares of common stock under our ATM common stock offering program for $127.91 per share and received net proceeds of $88.7 million. As of July 30, 2018, we had $17.7 million available for future sales under the ATM program. We expect to file a new ATM program in the next few quarters.
- In April 2018, our unconsolidated real estate joint venture at Menlo Gateway in our Greater Stanford submarket closed a secured note payable with commitments available for borrowing of $157.3 million, for the development of Phase II of the project. The loan matures on May 1, 2035, and bears interest at a fixed rate of 4.53%.
Corporate responsibility and industry leadership
- Nareit CARE Gold Award Winner
- 2018 recipient of the Nareit Gold Investor CARE (Communications and Reporting Excellence) Award in the Large Cap Equity REIT category as the best-in-class REIT that delivers transparency, quality, and efficient communications and reporting to the investment community, which is our third Nareit Gold Investor CARE Award (2015, 2016, and 2018).
- 50% of annual rental revenue is expected from LEED-certified projects upon completion of 10 in-process projects. In April 2018, 100 Binney Street in our Cambridge submarket received LEED Gold® certification, demonstrating our commitment to sustainability.
- In May 2018, Joel S. Marcus, executive chairman and founder, served as a keynote speaker at the Research Triangle Regional Partnership's 2018 State of the Region. The event highlighted how the region can facilitate economic growth and infrastructural improvements to prepare for more diversified expansion in the future.
- In June 2018, Joel S. Marcus was appointed to the Emily Krzyzewski Center board of directors. The Center serves as a college access hub propelling academically focused, low-income K-12 students and graduates toward success in college.
- In June 2018, Circulate San Diego awarded 9880 Campus Point Drive in our University Town Center submarket the Circulate Mobility Certification, formerly known as the MOVE Alliance Certification. The certification is awarded for transit-oriented, smart growth projects in the San Diego region.
- In June 2018, we released our inaugural 2017 Corporate Responsibility Report that highlights our continual efforts to make a positive, meaningful and purposeful impact on the health, safety and well-being of our tenants, stockholders and employees, as well as on the communities in which we live and work.
Subsequent events
- During 2Q18, we entered into a contract to sell a land parcel located in Northern Virginia and recognized an impairment of $6.3 million to lower the carrying amount to the estimated fair value less selling costs. We completed the sale, at a price of $6.0 million, in July 2018 with no gain or loss.
- In July 2018, we repaid $150.0 million of the outstanding balance of one secured construction loan. In connection with the partial repayment of the secured construction loan, we recognized a loss on early extinguishment of debt of $299 thousand related to the write-off of unamortized loan fees.
|
Sustainability |
|
June 30, 2018 |
|
Acquisitions |
|||||||||||||||||||||||||||||||
|
June 30, 2018 |
|||||||||||||||||||||||||||||||
|
(Dollars in thousands) |
|||||||||||||||||||||||||||||||
|
Property |
Submarket/Market |
Date of |
Number of |
Operating Occupancy |
Square Footage |
Unlevered Yields |
|||||||||||||||||||||||||
|
Operating |
Operating with |
Future Development |
Initial |
Initial |
|||||||||||||||||||||||||||
|
Purchase Price |
|||||||||||||||||||||||||||||||
|
Future Development |
|||||||||||||||||||||||||||||||
|
701 Dexter Avenue North |
Lake Union/Seattle |
7/20/18 |
1 |
N/A |
— |
— |
217,000 |
(1) |
(1) |
$ |
33,500 |
||||||||||||||||||||
|
Other |
Various |
Various |
— |
N/A |
— |
— |
493,000 |
(1) |
(1) |
58,205 |
|||||||||||||||||||||
|
Operating with Value-Creation |
|||||||||||||||||||||||||||||||
|
219 East 42nd Street |
Manhattan/New York City |
7/10/18 |
1 |
100% |
— |
349,947 |
(2) |
— |
6.8% |
(2) |
6.7% |
(2) |
203,000 |
||||||||||||||||||
|
100 Tech Drive |
Route 128/Greater Boston |
4/13/18 |
1 |
100% |
200,431 |
— |
300,000 |
8.7% |
7.3% |
87,250 |
|||||||||||||||||||||
|
Operating |
|||||||||||||||||||||||||||||||
|
Maryland Life Science Portfolio |
Rockville/Gaithersburg/ |
5/8/18 |
8 |
100% |
376,106 |
39,505 |
— |
9.1% |
7.0% |
(3) |
146,500 |
||||||||||||||||||||
|
2301 5th Avenue |
Lake Union/Seattle |
6/1/18 |
1 |
97% |
197,136 |
— |
— |
8.3% |
5.1% |
(3) |
95,000 |
||||||||||||||||||||
|
Other |
Various |
Various |
2 |
100% |
54,341 |
— |
— |
N/A |
N/A |
39,400 |
(4) |
||||||||||||||||||||
|
14 |
828,014 |
389,452 |
1,010,000 |
662,855 |
|||||||||||||||||||||||||||
|
1Q18 acquisitions |
339,400 |
||||||||||||||||||||||||||||||
|
Total |
$ |
1,002,255 |
|||||||||||||||||||||||||||||
|
2018 guidance midpoint |
$ |
1,010,000 |
|||||||||||||||||||||||||||||
|
(1) |
We expect to provide total estimated costs and related yields of development and redevelopment projects in the future. |
|
(2) |
We acquired a fee simple interest in this office building, which is currently occupied by Pfizer Inc. with a remaining lease term of six years. Upon expiration of the lease, we have the opportunity to increase cash flows through the conversion of office space into office/laboratory space through redevelopment. Under the Midtown East Rezoning, this property is currently entitled with an as-of-right density for an additional 230,000 developable square feet. Unlevered initial stabilized yields represent initial returns during the Pfizer, Inc. occupancy prior to any future redevelopment activities. We expect to provide total estimated costs and related yields of the development or redevelopment in the future. |
|
(3) |
These properties provide an opportunity to increase cash flows through the re-leasing of in-place leases currently 16% and 25% below market at the Maryland Life Science Portfolio and 2301 5th Avenue, respectively. |
|
(4) |
Includes, among others, the final installment related to our November 2016 acquisition of 1455 and 1515 Third Street of $18.9 million which was paid during the three months ended June 30, 2018. |
|
Guidance | ||||||||||
|
June 30, 2018 | ||||||||||
|
(Dollars in millions, except per share amounts) | ||||||||||
|
The following updated guidance is based on our current view of existing market conditions and assumptions for the year ending December 31, 2018. There can be no assurance that actual amounts will be materially higher or lower than these expectations. See our discussion of "forward-looking statements" on page 8 of this Earnings Press Release for additional information. | ||||||||||
|
Guidance |
Guidance | |||||||||
|
Summary of Key Changes in Guidance |
As of 7/30/18 |
As of 4/30/18 |
Summary of Key Changes in Guidance |
As of 7/30/18 |
As of 4/30/18 | |||||
|
EPS, FFO per share, and FFO per share, as adjusted |
See updates below(1) |
Key sources and uses of capital |
(2) |
N/A | ||||||
|
Occupancy percentage in North America as of December 31, 2018 |
97.1% to 97.7% |
96.9% to 97.5% |
Rental rate increases |
17.0% to 20.0% |
13.0% to 16.0% | |||||
|
Rental rate increases (cash basis) |
9.5% to 12.5% |
7.5% to 10.5% | ||||||||
|
Projected Earnings per Share and Funds From Operations per Share Attributable to Alexandria's |
|||||||||
|
As of 7/30/18 |
As of 4/30/18 |
||||||||
|
Earnings per share |
$2.87 to $2.93 |
$2.88 to $2.98 |
|||||||
|
Depreciation and amortization |
4.50 |
4.45 |
|||||||
|
Allocation to unvested restricted stock awards |
(0.05) |
(0.05) |
|||||||
|
Funds from operations per share |
$7.32 to $7.38 |
$7.28 to $7.38 |
|||||||
|
Realized gain on non-real estate investment in 1Q18 |
(0.08) |
(0.08) |
|||||||
|
Unrealized gains on non-real estate investments(3) |
(0.76) |
(0.70) |
|||||||
|
Impairment of real estate – land parcels(4) |
0.06 |
— |
|||||||
|
Allocation to unvested restricted stock awards/other |
0.03 |
0.02 |
|||||||
|
Funds from operations per share, as adjusted |
$6.57 to $6.63 |
$6.52 to $6.62 |
|||||||
|
Midpoint |
$6.60 |
$6.57 |
|||||||
|
Key Assumptions |
Low |
High |
|||||||
|
Occupancy percentage in North America as of December 31, 2018 |
97.1% |
97.7% |
|||||||
|
Lease renewals and re-leasing of space: |
|||||||||
|
Rental rate increases |
17.0% |
20.0% |
|||||||
|
Rental rate increases (cash basis) |
9.5% |
12.5% |
|||||||
|
Same property performance: |
|||||||||
|
Net operating income increase |
2.5% |
4.5% |
|||||||
|
Net operating income increase (cash basis) |
9.0% |
11.0% |
|||||||
|
Straight-line rent revenue |
$ |
92 |
$ |
102 |
(7) | ||||
|
General and administrative expenses |
$ |
85 |
$ |
90 |
|||||
|
Capitalization of interest |
$ |
55 |
$ |
65 |
|||||
|
Interest expense |
$ |
155 |
$ |
165 |
|||||
|
Guidance |
|||
|
Key Credit Metrics |
|||
|
Net debt to Adjusted EBITDA – 4Q18 annualized |
Less than 5.5x |
||
|
Net debt and preferred stock to Adjusted EBITDA – 4Q18 annualized |
Less than 5.5x |
||
|
Fixed-charge coverage ratio – 4Q18 annualized |
Greater than 4.0x |
||
|
Unhedged variable-rate debt as a percentage of total debt as of December 31, 2018 |
Less than 5% |
||
|
Value-creation pipeline as a percentage of gross real estate as of December 31, 2018 |
8% to 12% |
|
Key Sources and Uses of Capital |
Range |
Midpoint |
Certain | |||||||||||||||
|
Sources of capital: |
||||||||||||||||||
|
Net cash provided by operating activities after dividends |
$ |
140 |
$ |
180 |
$ |
160 |
||||||||||||
|
Incremental debt |
540 |
500 |
520 |
|||||||||||||||
|
Real estate dispositions, partial interest sales, and |
1,330 |
1,530 |
1,430 |
$ |
1,200 |
(5) | ||||||||||||
|
Total sources of capital |
$ |
2,010 |
$ |
2,210 |
$ |
2,110 |
||||||||||||
|
Uses of capital: |
||||||||||||||||||
|
Construction |
$ |
1,050 |
$ |
1,150 |
$ |
1,100 |
||||||||||||
|
Acquisitions |
960 |
1,060 |
1,010 |
(6) |
||||||||||||||
|
Total uses of capital |
$ |
2,010 |
$ |
2,210 |
$ |
2,110 |
||||||||||||
|
Incremental debt (included above): |
||||||||||||||||||
|
Issuance of unsecured senior notes payable |
$ |
900 |
$ |
900 |
$ |
900 |
$ |
900 |
||||||||||
|
Repayments of secured notes payable |
(160) |
(165) |
(163) |
$ |
(150) |
|||||||||||||
|
Repayment of unsecured senior bank term loan |
(200) |
(200) |
(200) |
|||||||||||||||
|
$1.65 billion unsecured senior line of credit/other |
— |
(35) |
(17) |
|||||||||||||||
|
Incremental debt |
$ |
540 |
$ |
500 |
$ |
520 |
||||||||||||
|
(1) |
Midpoint of FFO per share, as adjusted guidance increased by $0.03 from $6.57 to $6.60 primarily due to the incremental acquisitions as noted in footnote 2, and the continued strength of our core and the related increases in projected occupancy and rental rate growth on leasing activity. |
|
(2) |
Updates to key sources and uses of capital guidance for 2018 include: (a) $290 million increase in the midpoint of acquisitions range from $720 million to $1.0 billion, (b) $220 million increase in the midpoint of real estate dispositions, partial interest sales, and common equity range from $1.2 billion to $1.4 billion, (c) $300 million increase in issuance of unsecured senior notes payable reflecting the June 2018 issuance of our $900 million unsecured senior notes, and (d) $150 million increase in repayments of secured notes payable reflecting the July 2018 partial repayment of our secured construction loan. |
|
(3) |
Per share amounts of unrealized gains on non-real estate investments may be different for the full year ending December 31, 2018, depending on the weighted-average shares outstanding for the year ending December 31, 2018. Excludes future unrealized gains or losses that could be recognized in earnings from changes in fair value of equity investments after June 30, 2018. See page 46 of our Supplemental Information for additional information. |
|
(4) |
Impairment of real estate aggregating $6.3 million recognized during the three months ended June 30, 2018, related to one land parcel located in Northern Virginia that was subsequently sold in July 2018 with no gain or loss. |
|
(5) |
We have completed transactions aggregating $1.2 billion through July 2018. This includes completed and projected settlement of our forward equity sales agreements and completed sales under our ATM program. In January 2018, we executed forward equity sales agreements for 6.9 million shares of our common stock. In March 2018, we settled 843,600 shares from the forward equity sales agreements and received proceeds of $100.2 million, net of underwriting discounts and adjustments provided in the forward equity sales agreements. We expect to receive proceeds of $709.9 million upon settlement of the remaining outstanding forward equity sales agreements, to be further adjusted as provided in the sales agreements, in 2018. During the three months ended June 30, 2018, we sold 2.5 million shares of common stock under our ATM program at $124.46 per share, with net proceeds of $300.8 million. In July 2018, we sold 703,625 shares of common stock under our ATM common stock offering program for $127.91 per share and received net proceeds of $88.7 million. |
|
(6) |
See "Acquisitions" on page 5 of this Earnings Press Release for additional information. |
|
(7) |
Approximately 50% of straight-line rent revenue represents initial free rent on recently delivered and expected 2018 deliveries of new Class A properties from our development and redevelopment pipeline. |
Earnings Call Information and About the Company
June 30, 2018
We will host a conference call on Tuesday, July 31, 2018, at 3:00 p.m. Eastern Time ("ET")/noon Pacific Time ("PT"), which is open to the general public to discuss our financial and operating results for the second quarter ended June 30, 2018. To participate in this conference call, dial (877) 270-2148 or (412) 902-6510 shortly before 3:00 p.m. ET/noon PT and ask the operator to join the Alexandria Real Estate Equities, Inc. call. The audio webcast can be accessed at www.are.com in the "For Investors" section. A replay of the call will be available for a limited time from 5:00 p.m. ET/2:00 p.m. PT on Tuesday, July 31, 2018. The replay number is (877) 344-7529 or (412) 317-0088, and the confirmation code is 10118275.
Additionally, a copy of this Earnings Press Release and Supplemental Information for the second quarter ended June 30, 2018, is available in the "For Investors" section of our website at www.are.com or by following this link: http://www.are.com/fs/2018q2.pdf.
For any questions, please contact Joel S. Marcus, executive chairman and founder; Stephen A. Richardson, co-chief executive officer; Peter M. Moglia, co-chief executive officer and co-chief investment officer; Dean A. Shigenaga, co-president and chief financial officer; or Sara M. Kabakoff, assistant vice president – corporate communications, at (626) 578-0777.
About the Company
Alexandria Real Estate Equities, Inc. ARE, an S&P 500® company, is an urban office real estate investment trust ("REIT") uniquely focused on collaborative life science and technology campuses in AAA innovation cluster locations, with a total market capitalization of $18.8 billion and an asset base in North America of 32.0 million SF as of June 30, 2018. The asset base in North America includes 21.5 million RSF of operating properties and 3.5 million RSF of development and redevelopment of new Class A properties currently undergoing construction and pre-construction activities with target delivery dates ranging from 2018 through 2020. Additionally, the asset base in North America includes 7.0 million SF of intermediate-term and future development projects. Founded in 1994, Alexandria pioneered this niche and has since established a significant market presence in key locations, including Greater Boston, San Francisco, New York City, San Diego, Seattle, Maryland, and Research Triangle Park. Alexandria has a longstanding and proven track record of developing Class A properties clustered in urban life science and technology campuses that provide its innovative tenants with highly dynamic and collaborative environments that enhance their ability to successfully recruit and retain world-class talent and inspire productivity, efficiency, creativity, and success. Alexandria also provides strategic capital to transformative life science and technology companies through its venture capital arm. We believe our unique business model and diligent underwriting ensure a high-quality and diverse tenant base that results in higher occupancy levels, longer lease terms, higher rental income, higher returns, and greater long-term asset value. For additional information on Alexandria, please visit www.are.com.
***********
This document includes "forward-looking statements" within the meaning of Section 27A of the Securities Act of 1933, as amended, and Section 21E of the Securities Exchange Act of 1934, as amended. Such forward-looking statements include, without limitation, statements regarding our 2018 earnings per share attributable to Alexandria's common stockholders – diluted, 2018 funds from operations per share attributable to Alexandria's common stockholders – diluted, net operating income, and our projected sources and uses of capital. You can identify the forward-looking statements by their use of forward-looking words, such as "forecast," "guidance," "projects," "estimates," "anticipates," "goals," "believes," "expects," "intends," "may," "plans," "seeks," "should," or "will," or the negative of those words or similar words. These forward-looking statements are based on our current expectations, beliefs, projections, future plans and strategies, anticipated events or trends, and similar expressions concerning matters that are not historical facts, as well as a number of assumptions concerning future events. There can be no assurance that actual results will not be materially higher or lower than these expectations. These statements are subject to risks, uncertainties, assumptions, and other important factors that could cause actual results to differ materially from the results discussed in the forward-looking statements. Factors that might cause such a difference include, without limitation, our failure to obtain capital (debt, construction financing, and/or equity) or refinance debt maturities, increased interest rates and operating costs, adverse economic or real estate developments in our markets, our failure to successfully place into service and lease any properties undergoing development or redevelopment and our existing space held for future development or redevelopment (including new properties acquired for that purpose), our failure to successfully operate or lease acquired properties, decreased rental rates, increased vacancy rates or failure to renew or replace expiring leases, defaults on or non-renewal of leases by tenants, adverse general and local economic conditions, an unfavorable capital market environment, decreased leasing activity or lease renewals, and other risks and uncertainties detailed in our filings with the Securities and Exchange Commission ("SEC"). Accordingly, you are cautioned not to place undue reliance on such forward-looking statements. All forward-looking statements are made as of the date of this Earnings Press Release, and unless otherwise stated, we assume no obligation to update this information and expressly disclaim any obligation to update or revise any forward-looking statements, whether as a result of new information, future events, or otherwise. For more discussion relating to risks and uncertainties that could cause actual results to differ materially from those anticipated in our forward-looking statements, and risks to our business in general, please refer to our SEC filings, including our most recent annual report on Form 10-K and any subsequent quarterly reports on Form 10-Q.
Alexandria®, Lighthouse Design® logo, Building the Future of Life-Changing Innovation™, LaunchLabs®, Alexandria Center®, Alexandria Technology Square®, and Alexandria Summit® are trademarks of Alexandria Real Estate Equities, Inc. All other company names, trademarks, and logos referenced herein are the property of their respective owners.
|
Consolidated Statements of Income |
||||||||||||||||||||||||||||
|
June 30, 2018 |
||||||||||||||||||||||||||||
|
(In thousands, except per share amounts) |
||||||||||||||||||||||||||||
|
Three Months Ended |
Six Months Ended | |||||||||||||||||||||||||||
|
6/30/18 |
3/31/18 |
12/31/17 |
9/30/17 |
6/30/17 |
6/30/18 |
6/30/17 | ||||||||||||||||||||||
|
Revenues: |
||||||||||||||||||||||||||||
|
Rental |
$ |
250,635 |
$ |
244,485 |
$ |
228,025 |
$ |
216,021 |
$ |
211,942 |
$ |
495,120 |
$ |
419,135 |
||||||||||||||
|
Tenant recoveries |
72,159 |
73,170 |
70,270 |
67,058 |
60,470 |
145,329 |
121,816 |
|||||||||||||||||||||
|
Other income |
2,240 |
2,484 |
496 |
2,291 |
647 |
4,724 |
2,985 |
|||||||||||||||||||||
|
Total revenues |
325,034 |
320,139 |
298,791 |
285,370 |
273,059 |
645,173 |
543,936 |
|||||||||||||||||||||
|
Expenses: |
||||||||||||||||||||||||||||
|
Rental operations |
91,908 |
91,771 |
88,073 |
83,469 |
76,980 |
183,679 |
154,067 |
|||||||||||||||||||||
|
General and administrative |
22,939 |
22,421 |
18,910 |
17,636 |
19,234 |
45,360 |
38,463 |
|||||||||||||||||||||
|
Interest |
38,097 |
36,915 |
36,082 |
31,031 |
31,748 |
75,012 |
61,532 |
|||||||||||||||||||||
|
Depreciation and amortization |
118,852 |
114,219 |
107,714 |
107,788 |
104,098 |
233,071 |
201,281 |
|||||||||||||||||||||
|
Impairment of real estate |
6,311 |
— |
— |
— |
203 |
6,311 |
203 |
|||||||||||||||||||||
|
Loss on early extinguishment of debt |
— |
— |
2,781 |
— |
— |
— |
670 |
|||||||||||||||||||||
|
Total expenses |
278,107 |
265,326 |
253,560 |
239,924 |
232,263 |
543,433 |
456,216 |
|||||||||||||||||||||
|
Equity in earnings of unconsolidated real estate joint ventures |
1,090 |
1,144 |
376 |
14,100 |
589 |
2,234 |
950 |
|||||||||||||||||||||
|
Investment income(1) |
12,530 |
85,561 |
— |
— |
— |
98,091 |
— |
|||||||||||||||||||||
|
Gain on sales of real estate – rental properties |
— |
— |
— |
— |
— |
— |
270 |
|||||||||||||||||||||
|
Gain on sales of real estate – land parcels |
— |
— |
— |
— |
111 |
— |
111 |
|||||||||||||||||||||
|
Net income |
60,547 |
141,518 |
45,607 |
59,546 |
41,496 |
202,065 |
89,051 |
|||||||||||||||||||||
|
Net income attributable to noncontrolling interests |
(5,817) |
(5,888) |
(6,219) |
(5,773) |
(7,275) |
(11,705) |
(13,119) |
|||||||||||||||||||||
|
Net income attributable to Alexandria Real Estate Equities, Inc.'s |
54,730 |
135,630 |
39,388 |
53,773 |
34,221 |
190,360 |
75,932 |
|||||||||||||||||||||
|
Dividends on preferred stock |
(1,302) |
(1,302) |
(1,302) |
(1,302) |
(1,278) |
(2,604) |
(5,062) |
|||||||||||||||||||||
|
Preferred stock redemption charge |
— |
— |
— |
— |
— |
— |
(11,279) |
|||||||||||||||||||||
|
Net income attributable to unvested restricted stock awards |
(1,412) |
(1,941) |
(1,255) |
(1,198) |
(1,313) |
(2,765) |
(2,300) |
|||||||||||||||||||||
|
Net income attributable to Alexandria Real Estate Equities, Inc.'s |
$ |
52,016 |
$ |
132,387 |
$ |
36,831 |
$ |
51,273 |
$ |
31,630 |
$ |
184,991 |
$ |
57,291 |
||||||||||||||
|
Net income per share attributable to Alexandria Real Estate Equities, |
||||||||||||||||||||||||||||
|
Basic |
$ |
0.51 |
$ |
1.33 |
$ |
0.39 |
$ |
0.55 |
$ |
0.35 |
$ |
1.83 |
$ |
0.64 |
||||||||||||||
|
Diluted |
$ |
0.51 |
$ |
1.32 |
$ |
0.38 |
$ |
0.55 |
$ |
0.35 |
$ |
1.83 |
$ |
0.64 |
||||||||||||||
|
Weighted-average shares of common stock outstanding: |
||||||||||||||||||||||||||||
|
Basic |
101,881 |
99,855 |
95,138 |
92,598 |
90,215 |
100,878 |
89,186 |
|||||||||||||||||||||
|
Diluted |
102,236 |
100,125 |
95,914 |
93,296 |
90,745 |
101,191 |
89,479 |
|||||||||||||||||||||
|
Dividends declared per share of common stock |
$ |
0.93 |
$ |
0.90 |
$ |
0.90 |
$ |
0.86 |
$ |
0.86 |
$ |
1.83 |
$ |
1.69 |
||||||||||||||
|
(1) |
See "Investments" on page 46 of our Supplemental Information for additional information. |
|
Consolidated Balance Sheets | ||||||||||||||||||||
|
June 30, 2018 | ||||||||||||||||||||
|
(In thousands) | ||||||||||||||||||||
|
6/30/18 |
3/31/18 |
12/31/17 |
9/30/17 |
6/30/17 | ||||||||||||||||
|
Assets |
||||||||||||||||||||
|
Investments in real estate |
$ |
11,190,771 |
$ |
10,671,227 |
$ |
10,298,019 |
$ |
10,046,521 |
$ |
9,819,413 |
||||||||||
|
Investments in unconsolidated real estate joint ventures |
192,972 |
169,865 |
110,618 |
33,692 |
58,083 |
|||||||||||||||
|
Cash and cash equivalents |
287,029 |
221,645 |
254,381 |
118,562 |
124,877 |
|||||||||||||||
|
Restricted cash |
34,812 |
37,337 |
22,805 |
27,713 |
20,002 |
|||||||||||||||
|
Tenant receivables |
8,704 |
11,258 |
10,262 |
9,899 |
8,393 |
|||||||||||||||
|
Deferred rent |
490,428 |
467,112 |
434,731 |
402,353 |
383,062 |
|||||||||||||||
|
Deferred leasing costs |
232,964 |
226,803 |
221,430 |
208,265 |
201,908 |
|||||||||||||||
|
Investments |
790,753 |
724,310 |
523,254 |
485,262 |
424,920 |
|||||||||||||||
|
Other assets |
333,757 |
291,639 |
228,453 |
213,056 |
205,009 |
|||||||||||||||
|
Total assets |
$ |
13,562,190 |
$ |
12,821,196 |
$ |
12,103,953 |
$ |
11,545,323 |
$ |
11,245,667 |
||||||||||
|
Liabilities, Noncontrolling Interests, and Equity |
||||||||||||||||||||
|
Secured notes payable |
$ |
776,260 |
$ |
775,689 |
$ |
771,061 |
$ |
1,153,890 |
$ |
1,127,348 |
||||||||||
|
Unsecured senior notes payable |
4,289,521 |
3,396,912 |
3,395,804 |
2,801,290 |
2,800,398 |
|||||||||||||||
|
Unsecured senior line of credit |
— |
490,000 |
50,000 |
314,000 |
300,000 |
|||||||||||||||
|
Unsecured senior bank term loans |
548,324 |
548,197 |
547,942 |
547,860 |
547,639 |
|||||||||||||||
|
Accounts payable, accrued expenses, and tenant security deposits |
849,274 |
783,986 |
763,832 |
740,070 |
734,189 |
|||||||||||||||
|
Dividends payable |
98,676 |
93,065 |
92,145 |
83,402 |
81,602 |
|||||||||||||||
|
Total liabilities |
6,562,055 |
6,087,849 |
5,620,784 |
5,640,512 |
5,591,176 |
|||||||||||||||
|
Commitments and contingencies |
||||||||||||||||||||
|
Redeemable noncontrolling interests |
10,861 |
10,212 |
11,509 |
11,418 |
11,410 |
|||||||||||||||
|
Alexandria Real Estate Equities, Inc.'s stockholders' equity: |
||||||||||||||||||||
|
7.00% Series D cumulative convertible preferred stock |
74,386 |
74,386 |
74,386 |
74,386 |
74,386 |
|||||||||||||||
|
Common stock |
1,033 |
1,007 |
998 |
943 |
921 |
|||||||||||||||
|
Additional paid-in capital |
6,387,527 |
6,117,976 |
5,824,258 |
5,287,777 |
5,059,180 |
|||||||||||||||
|
Accumulated other comprehensive (loss) income |
(2,485) |
1,228 |
50,024 |
43,864 |
22,677 |
|||||||||||||||
|
Alexandria Real Estate Equities, Inc.'s stockholders' equity |
6,460,461 |
6,194,597 |
5,949,666 |
5,406,970 |
5,157,164 |
|||||||||||||||
|
Noncontrolling interests |
528,813 |
528,538 |
521,994 |
486,423 |
485,917 |
|||||||||||||||
|
Total equity |
6,989,274 |
6,723,135 |
6,471,660 |
5,893,393 |
5,643,081 |
|||||||||||||||
|
Total liabilities, noncontrolling interests, and equity |
$ |
13,562,190 |
$ |
12,821,196 |
$ |
12,103,953 |
$ |
11,545,323 |
$ |
11,245,667 |
||||||||||
|
Funds From Operations and Funds From Operations per Share |
|||||||||||||||||||||||||||||||||||||||||||||||||||||||||||||
|
June 30, 2018 |
|||||||||||||||||||||||||||||||||||||||||||||||||||||||||||||
|
(In thousands) |
|||||||||||||||||||||||||||||||||||||||||||||||||||||||||||||
|
The following table presents a reconciliation of net income attributable to Alexandria's common stockholders, the most directly comparable financial measure presented in accordance with generally accepted accounting principles ("GAAP"), including our share of amounts from consolidated and unconsolidated real estate joint ventures, to funds from operations attributable to Alexandria's common stockholders – diluted, and funds from operations attributable to Alexandria's common stockholders – diluted, as adjusted, for the periods below: |
|||||||||||||||||||||||||||||||||||||||||||||||||||||||||||||
|
Three Months Ended |
Six Months Ended | ||||||||||||||||||||||||||||||||||||||||||||||||||||||||||||
|
6/30/18 |
3/31/18 |
12/31/17 |
9/30/17 |
6/30/17 |
6/30/18 |
6/30/17 | |||||||||||||||||||||||||||||||||||||||||||||||||||||||
|
Net income attributable to Alexandria's common stockholders |
$ |
52,016 |
$ |
132,387 |
$ |
36,831 |
$ |
51,273 |
$ |
31,630 |
$ |
184,991 |
$ |
57,291 |
|||||||||||||||||||||||||||||||||||||||||||||||
|
Depreciation and amortization |
118,852 |
114,219 |
107,714 |
107,788 |
104,098 |
233,071 |
201,281 |
||||||||||||||||||||||||||||||||||||||||||||||||||||||
|
Noncontrolling share of depreciation and amortization from consolidated real |
(3,914) |
(3,867) |
(3,777) |
(3,608) |
(3,735) |
(7,781) |
(7,377) |
||||||||||||||||||||||||||||||||||||||||||||||||||||||
|
Our share of depreciation and amortization from unconsolidated real estate JVs |
807 |
644 |
432 |
383 |
324 |
1,451 |
736 |
||||||||||||||||||||||||||||||||||||||||||||||||||||||
|
Gain on sales of real estate – rental properties |
— |
— |
— |
— |
— |
— |
(270) |
||||||||||||||||||||||||||||||||||||||||||||||||||||||
|
Our share of gain on sales of real estate from unconsolidated real estate JVs |
— |
— |
— |
(14,106) |
— |
— |
— |
||||||||||||||||||||||||||||||||||||||||||||||||||||||
|
Gain on sales of real estate – land parcels |
— |
— |
— |
— |
(111) |
— |
(111) |
||||||||||||||||||||||||||||||||||||||||||||||||||||||
|
Impairment of real estate – rental properties |
— |
— |
— |
— |
203 |
— |
203 |
||||||||||||||||||||||||||||||||||||||||||||||||||||||
|
Allocation to unvested restricted stock awards |
(1,042) |
(1,548) |
(734) |
(957) |
(685) |
(3,212) |
(1,245) |
||||||||||||||||||||||||||||||||||||||||||||||||||||||
|
Dilutive effect of assumed conversion of 7.00% Series D cumulative convertible |
— |
1,302 |
— |
— |
— |
2,604 |
— |
||||||||||||||||||||||||||||||||||||||||||||||||||||||
|
Funds from operations attributable to Alexandria's common stockholders – |
166,719 |
243,137 |
140,466 |
140,773 |
131,724 |
411,124 |
250,508 |
||||||||||||||||||||||||||||||||||||||||||||||||||||||
|
Unrealized gains on non-real estate investments(1) |
(5,067) |
(72,229) |
— |
— |
— |
(77,296) |
— |
||||||||||||||||||||||||||||||||||||||||||||||||||||||
|
Realized gain on non-real estate investment |
— |
(8,252) |
— |
— |
— |
(8,252) |
— |
||||||||||||||||||||||||||||||||||||||||||||||||||||||
|
Removal of dilutive effect of assumed conversion of 7.00% Series D |
— |
(1,302) |
— |
— |
— |
(2,604) |
— |
||||||||||||||||||||||||||||||||||||||||||||||||||||||
|
Impairment of land parcels and non-real estate investments |
6,311 |
(3) |
— |
3,805 |
— |
4,491 |
6,311 |
(3) |
4,491 |
||||||||||||||||||||||||||||||||||||||||||||||||||||
|
Loss on early extinguishment of debt |
— |
— |
2,781 |
— |
— |
— |
670 |
||||||||||||||||||||||||||||||||||||||||||||||||||||||
|
Preferred stock redemption charge |
— |
— |
— |
— |
— |
— |
11,279 |
||||||||||||||||||||||||||||||||||||||||||||||||||||||
|
Allocation to unvested restricted stock awards |
(18) |
1,125 |
(94) |
— |
(58) |
1,140 |
(209) |
||||||||||||||||||||||||||||||||||||||||||||||||||||||
|
Funds from operations attributable to Alexandria's common stockholders – |
$ |
167,945 |
$ |
162,479 |
$ |
146,958 |
$ |
140,773 |
$ |
136,157 |
$ |
330,423 |
$ |
266,739 |
|||||||||||||||||||||||||||||||||||||||||||||||
|
(1) |
On January 1, 2018, we adopted an ASU that requires changes in the fair value of our non-real estate investments to be recognized in net income. During the three months ended March 31, 2018, we recognized unrealized gains of $72.2 million. These unrealized gains are
|
|
We compute funds from operations, as adjusted, excluding unrealized gains or losses on non-real estate investments. As a result, the assumed conversion of our Series D preferred stock was reversed from our Nareit FFO calculation, as its impact was anti-dilutive on a per share basis for our funds from operations, as adjusted.
| |
|
See "Investments" on page 46 of our Supplemental Information for additional information. See definitions for "Funds from operations and funds from operations, as adjusted, attributable to Alexandria's common stockholders" and "Weighted-Average Shares of Common Stock Outstanding – Diluted" on pages 53 and 57, respectively, of our Supplemental Information for additional information. | |
|
(2) |
Calculated in accordance with standards established by the Advisory Board of Governors of the National Association of Real Estate Investment Trusts (the "Nareit Board of Governors") in its April 2002 White Paper and related implementation guidance. |
|
(3) |
Impairment of real estate recognized during the three months ended June 30, 2018, related to one land parcel located in Northern Virginia that was subsequently sold in July 2018 with no gain or loss. |
|
The following table presents a reconciliation of net income per share attributable to Alexandria's common stockholders, the most directly comparable financial measure presented in accordance with GAAP, including our share of amounts from consolidated and unconsolidated real estate joint ventures, to funds from operations per share attributable to Alexandria's common stockholders – diluted, and funds from operations per share attributable to Alexandria's common stockholders – diluted, as adjusted, for the periods below. Per share amounts may not add due to rounding. | ||||||||||||||||||||||||||||
|
Three Months Ended |
Six Months Ended | |||||||||||||||||||||||||||
|
6/30/18 |
3/31/18 |
12/31/17 |
9/30/17 |
6/30/17 |
6/30/18 |
6/30/17 | ||||||||||||||||||||||
|
Net income per share attributable to Alexandria's common stockholders |
$ |
0.51 |
$ |
1.32 |
$ |
0.38 |
$ |
0.55 |
$ |
0.35 |
$ |
1.83 |
$ |
0.64 |
||||||||||||||
|
Depreciation and amortization |
1.13 |
1.08 |
1.08 |
1.11 |
1.10 |
2.23 |
2.16 |
|||||||||||||||||||||
|
Our share of gain on sales of real estate from unconsolidated real estate JVs |
— |
— |
— |
(0.15) |
— |
— |
— |
|||||||||||||||||||||
|
Allocation to unvested restricted stock awards |
(0.01) |
— |
— |
— |
— |
(0.03) |
— |
|||||||||||||||||||||
|
Dilutive effect of assumed conversion of 7.00% Series D cumulative convertible |
— |
0.01 |
— |
— |
— |
— |
— |
|||||||||||||||||||||
|
Funds from operations per share attributable to Alexandria's common |
1.63 |
2.41 |
1.46 |
1.51 |
1.45 |
4.03 |
2.80 |
|||||||||||||||||||||
|
Unrealized gains on non-real estate investments(1) |
(0.05) |
(0.70) |
— |
— |
— |
(0.76) |
— |
|||||||||||||||||||||
|
Realized gain on non-real estate investment |
— |
(0.08) |
— |
— |
— |
(0.08) |
— |
|||||||||||||||||||||
|
Removal of dilutive effect of assumed conversion of 7.00% Series D cumulative |
— |
(0.01) |
— |
— |
— |
— |
— |
|||||||||||||||||||||
|
Impairment of land parcels and non-real estate investments |
0.06 |
(3) |
— |
0.04 |
— |
0.05 |
0.06 |
(3) |
0.05 |
|||||||||||||||||||
|
Loss on early extinguishment of debt |
— |
— |
0.03 |
— |
— |
— |
0.01 |
|||||||||||||||||||||
|
Preferred stock redemption charge |
— |
— |
— |
— |
— |
— |
0.12 |
|||||||||||||||||||||
|
Allocation to unvested restricted stock awards |
— |
— |
— |
— |
— |
0.02 |
— |
|||||||||||||||||||||
|
Funds from operations per share attributable to Alexandria's common stockholders – diluted, as adjusted |
$ |
1.64 |
$ |
1.62 |
$ |
1.53 |
$ |
1.51 |
$ |
1.50 |
$ |
3.27 |
$ |
2.98 |
||||||||||||||
|
Weighted-average shares of common stock outstanding(1) for calculations of: |
||||||||||||||||||||||||||||
|
Earnings per share – diluted and funds from operations – diluted, as adjusted, per |
102,236 |
100,125 |
95,914 |
93,296 |
90,745 |
101,191 |
89,479 |
|||||||||||||||||||||
|
Funds from operations – diluted, per share |
102,236 |
100,866 |
95,914 |
93,296 |
90,745 |
101,933 |
89,479 |
|||||||||||||||||||||
|
(1) |
See footnote 1 on prior page for additional information. |
|
(2) |
Calculated in accordance with standards established by the Nareit Board of Governors in its April 2002 White Paper and related implementation guidance. |
|
(3) |
See footnote 3 on prior page for additional information. |
![]() View original content with multimedia:http://www.prnewswire.com/news-releases/alexandria-real-estate-equities-inc-reports-second-quarter-ended-june-30-2018-financial-and-operating-results-strong-internal-and-external-growth-operational-excellence-and-growing-dividends-300688589.html
View original content with multimedia:http://www.prnewswire.com/news-releases/alexandria-real-estate-equities-inc-reports-second-quarter-ended-june-30-2018-financial-and-operating-results-strong-internal-and-external-growth-operational-excellence-and-growing-dividends-300688589.html
SOURCE Alexandria Real Estate Equities, Inc.

© 2024 Benzinga.com. Benzinga does not provide investment advice. All rights reserved.
Comments
Trade confidently with insights and alerts from analyst ratings, free reports and breaking news that affects the stocks you care about.

