


I continue to receive questions regarding the agonizing decline for the Consumer Staple Index in 2018 (we have no stake). As of this writing, consumer staples stocks are down -11.9% year to date as measured by the iShares Consumer Staples ETF IYK. Just for general knowledge, the main constituents of the index are Pepsi PEP, Coca-Cola KO, Procter & Gamble PG, Walmart WMT, and Costco COST. These are high-quality names that everyone is likely familiar with.>
The Consumer Staples Index is garnering attention due to its weakness on an absolute basis, but even more so as compared to the Consumer Discretionary Index. Here's a relative price chart which shows discretionary vs. staple stocks.

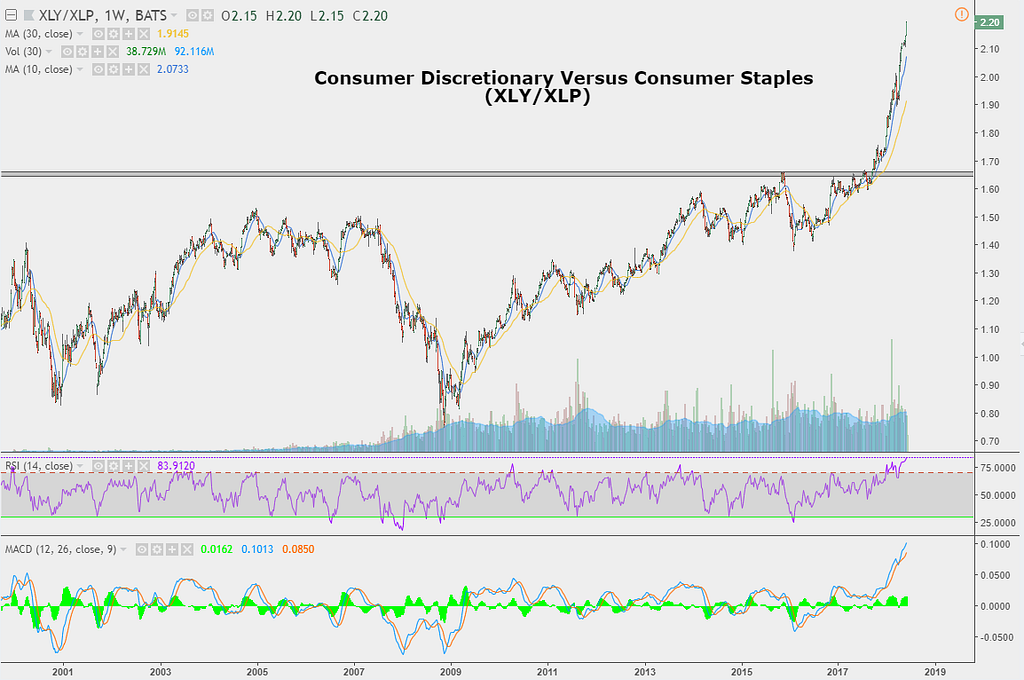
We track this relationship in our internal Avory Weekly Book as it is visible evidence of investor psychology. In August/September of 2017 discretionary stocks roared higher relative to staple names. This all-time high in the relative ratio was an internal bullish indicator for equities more broadly and has sustained its move.
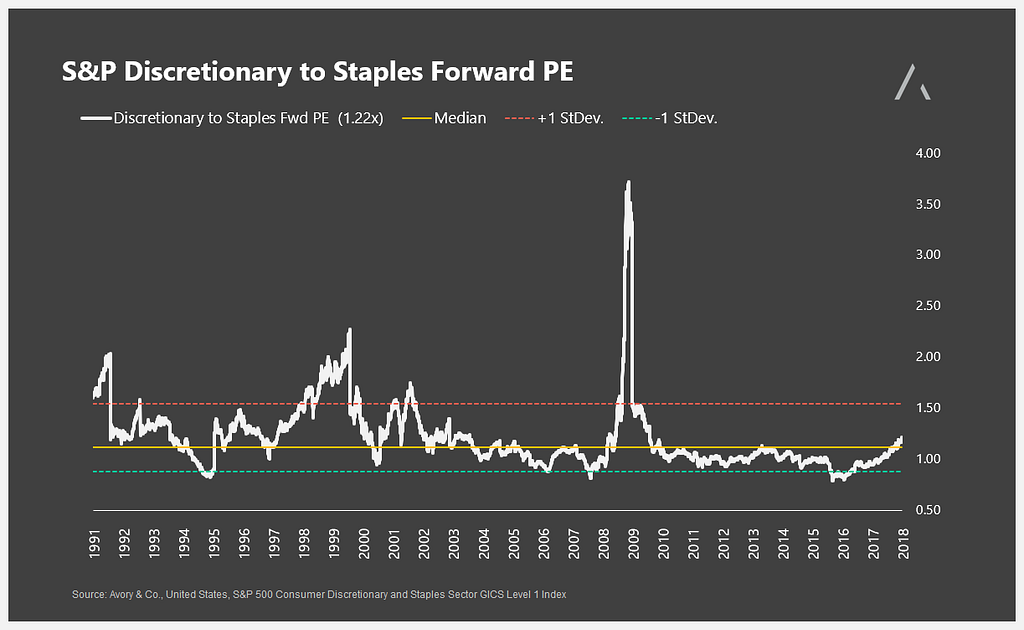
Given the rapid move higher, many are calling for this ratio to mean revert. While statisticians could have a suitable argument, I wanted to look under the hood from a valuation perspective. The chart below highlights the relative forward PE ratio of discretionary companies to staples. To be clear, this is a relative valuation chart, while above is a relative price chart. The yellow line is the median forward PE since 1990, and the red line indicates the upper bound of normal readings. Therefore, while the price chart does highlight a parabolic move higher since 2017, the valuation reading suggests that a mean reversion may have already taken place on a valuation basis.

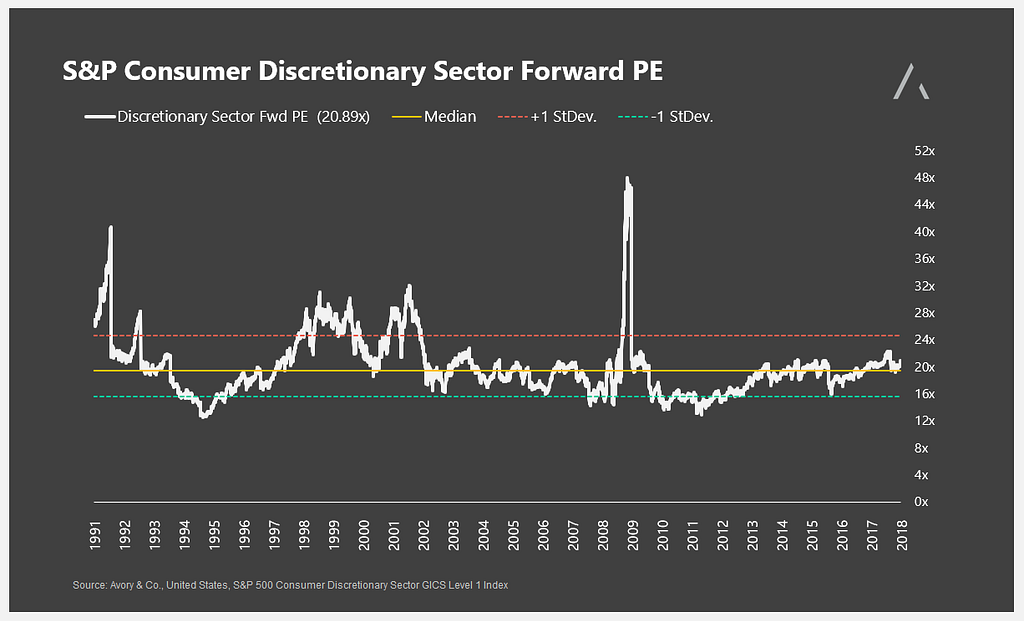
To go a step further, I wanted to show the absolute valuations for both sectors. First, let's start with the discretionary sector. In 2016 the sector was hitting the lower bound of reasonable valuations, suggesting that the sector may have been outright cheap at the time. Since then, valuations have migrated back towards the yellow median line since 1990.

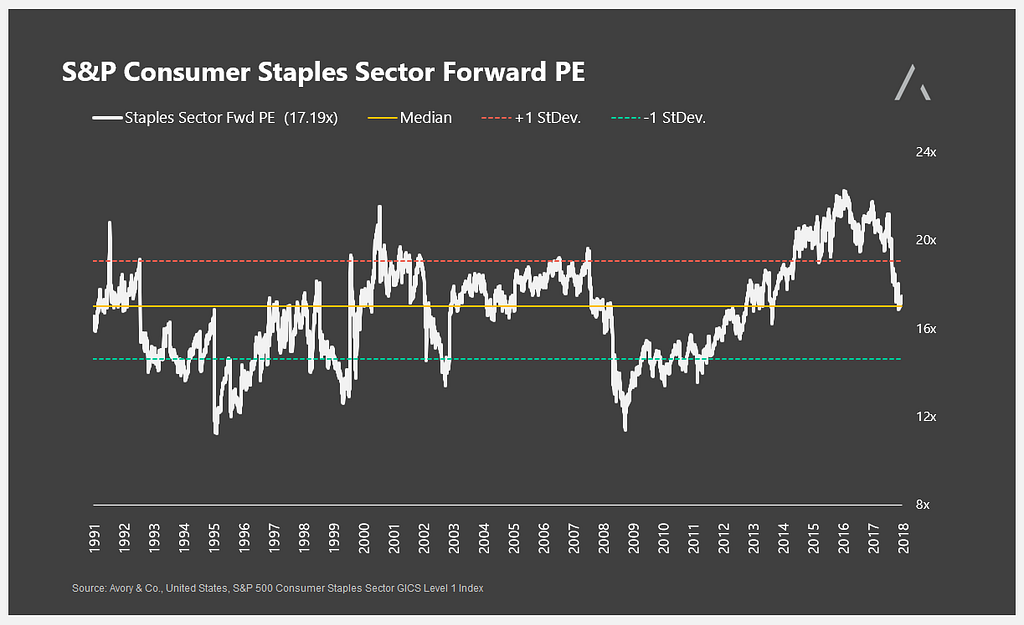
In comparison, consumer staples were hitting all-time high valuations in 2016 and have reverted lower to its median line since 1990.

To conclude, it is evident that the relative price chart of discretionary companies to staple companies may seem stretched by most observers. However, digging a little deeper I would say that the move seemed warranted if median valuations mean anything to you as an investor. With the relative valuation measure now back at median levels, the next move is unclear and will likely be dictated by operating performance.
Disclaimer: This is not a recommendation for purchase or sale of any securities. Avory does not own any of the securities listed above. This was also posted on See It Market. Avory & Co. Is a registered investment adviser. Information presented is for educational purposes only. Please see full disclaimer here.
This article was originally published in Avory & Co on Medium, where people are continuing the conversation by highlighting and responding to this story.

Related Links:
Giving Consumer Staples ETFs Another Chance
Barclays Finds Coca-Cola's Stock Refreshing As Consumer Staples Industry Suffers
© 2024 Benzinga.com. Benzinga does not provide investment advice. All rights reserved.
Trade confidently with insights and alerts from analyst ratings, free reports and breaking news that affects the stocks you care about.

