


(Friday market open) A critical U.S. inflation reading this morning harbored no ugly surprises, and major indexes built on Thursday’s gains in premarket trading as yields and volatility declined.
August core Personal Consumption Expenditures (PCE) prices—a data point closely watched by the Federal Reserve—rose 0.1% month-over-month, compared with the average Wall Street estimate of 0.2%. It rose 3.9% on an annual basis, in line with expectations (see more below).
The report shows “continued progress” in the fight against inflation, says Kevin Gordon, senior investment strategist at Schwab. “But now the key moving forward is whether the energy spike leads to other core measures moving higher,” he adds.
As the last day of the quarter begins, the good news is that the S&P 500 Index® (SPX) is up three of the last four sessions. The bad news is that it remains down 5% this month and couldn’t hold onto 4,300 yesterday. Also, there might be no government data to trade next week.
The weekend approaches with most signs pointing toward a government shutdown that would add to the uncertainty already out there with the autoworkers’ strike and the resumption of student loan payments. Still, investors shouldn’t panic.
“In cases of uncertainty, history may not be perfect, but it’s all we have,” says Randy Frederick, managing director of trading and derivatives at the Schwab Center for Financial Research. “The last eight government shutdowns were either neutral or positive for equities by the time the government reopened. Some are estimating a long shutdown. The longest ever lasted 35 days—it was also the most bullish, as equities gained 10.3% by the time it ended. Of course, past performance is not a guarantee.”
Before the PCE data, Treasury yields had been heading lower after notching new 16-year highs yesterday. Dovish comments Thursday from Chicago Fed President Austan Goolsbee may have contributed to the cooling yields. He warned of the risks of the Fed “overshooting” with its tightening policy, according to media reports.


Morning rush
- The 10-year Treasury note yield (TNX) is down 6 basis points at 4.53%, and extended losses after PCE.
- The U.S. Dollar Index ($DXY) fell slightly to 105.74 but remains near recent highs.
- Cboe Volatility Index® (VIX) futures eased substantially to 16.25 after PCE.
- WTI Crude Oil (/CL) is up 1.4%, approaching $93 per barrel.
Just in
Headline PCE prices rose 0.4% in August, the government said, compared with the 0.4% Briefing.com consensus. The core that rose 0.1% strips out volatile food and energy prices. Year-over-year core PCE was up 3.9%, exactly as analysts had expected and down from 4.2% in July—evidence of progress in the inflation fight.
Year-over-year headline inflation climbed 3.5%, also within the realm of expectations. The headline readings reflect higher energy prices last month. One worry is that rising energy costs could eventually seep into the core numbers as well, if they last long enough.
What to watch
Week ahead: Normally we’d focus on key jobs data due next week. However, with a government shutdown increasingly likely, it’s unclear whether investors will even receive the August job openings and September jobs growth and wage data scheduled for Tuesday and Friday, respectively.
If the reports get delayed, it could add volatility in a market that recently reached its most volatile levels since May. Lack of data also could make the Fed’s job harder as the next meeting looms at the end of the month.
If you’re hunting for non-government numbers, Monday morning’s September Institute for Supply Management (ISM) Manufacturing Index could provide clues about the industrial economy. It rose to 47.6% in August but has spent about a year below the 50% level that would signal expansion. Improved Chinese industrial data last month contributed to ideas that perhaps the long-suffering global manufacturing economy is improving, but one month isn’t a trend. Consensus on Wall Street is for a slight ISM rise to 47.8% in September, according to Trading Economics.
Government shutdown update: “A shutdown tomorrow night looks almost certain, but Congress will be in this weekend and next week trying to resolve issues,” says Michael Townsend, Schwab’s managing director of legislative and regulatory affairs.
Keep an eye on the VIX today for shakiness associated with the possible government shutdown and end-of-the-quarter “window dressing” that can set off a volatility charge. Window dressing is when fund managers dump losers and add winners before mailing results to clients.
Meanwhile, crude oil bounced again this morning, and the cause isn’t simply foreign cartels trimming production. Tight U.S. crude inventories are also underpinning prices despite U.S. daily production approaching all-time peaks last seen in late 2019.
Stocks in spotlight
Nike NKE earnings gave its downtrodden shares a 9% lift in premarket trading after the athletic apparel company beat analysts’ average earnings estimates and delivered revenue just below estimates. Gross margin flagged slightly but was better than Wall Street had expected, and the company appeared to make progress trimming inventory. JP Morgan JPM evidently liked what it saw, giving Nike an upgrade this morning. Other athletic apparel makers like Foot Locker FL and Lululemon (LULU) are basking in Nike’s glow, both posting solid gains in premarket trading.
From an earnings perspective, next week is the calm before the storm. The Q3 earnings season begins in earnest the following week, highlighted by a slew of big bank earnings on Friday, October 13. (Read what you like into that starting date.) Last week, analysts trimmed their expectations for Q3 S&P 500 earnings growth to -0.2% from the previous +0.2%, according to FactSet. Today should bring an update from that research firm.
Small-cap stocks outpaced the broader market yesterday, something often seen when there’s a recovery from weakness. Strength in the mega-caps after a rough start for those behemoths helped lift major indexes yesterday as Treasury yields and crude stepped back slightly. Big bank stocks also performed well. Breadth improved, with gainers outpacing losers about 2 to 1 at the New York Stock Exchange (NYSE). Most S&P 500 sectors rose Thursday.
Eye on the Fed
Early this morning, the probability that the Federal Open Market Committee (FOMC)will raise its benchmark funds rate from its current 5.25% to 5.50% target range following its October 31–November 1 meeting fell to just 12% after the PCE data release, according to the CME FedWatch Tool. Odds that rates could be a quarter-point higher coming out of the December 12–13 meeting were about 35%.
Talking technicals: The next key support level for the S&P 500 Index (SPX) is near 4,200, which is now close to the 200-day moving average, while the next key resistance level is just overhead at 4,330.
Defaults on rise: Corporate defaults and bankruptcies are picking up. In this new article, Collin Martin, a director of fixed income strategy at the Schwab Center for Financial Research, explains what’s happening and presents some approaches for investors to consider as they navigate the corporate bond market.
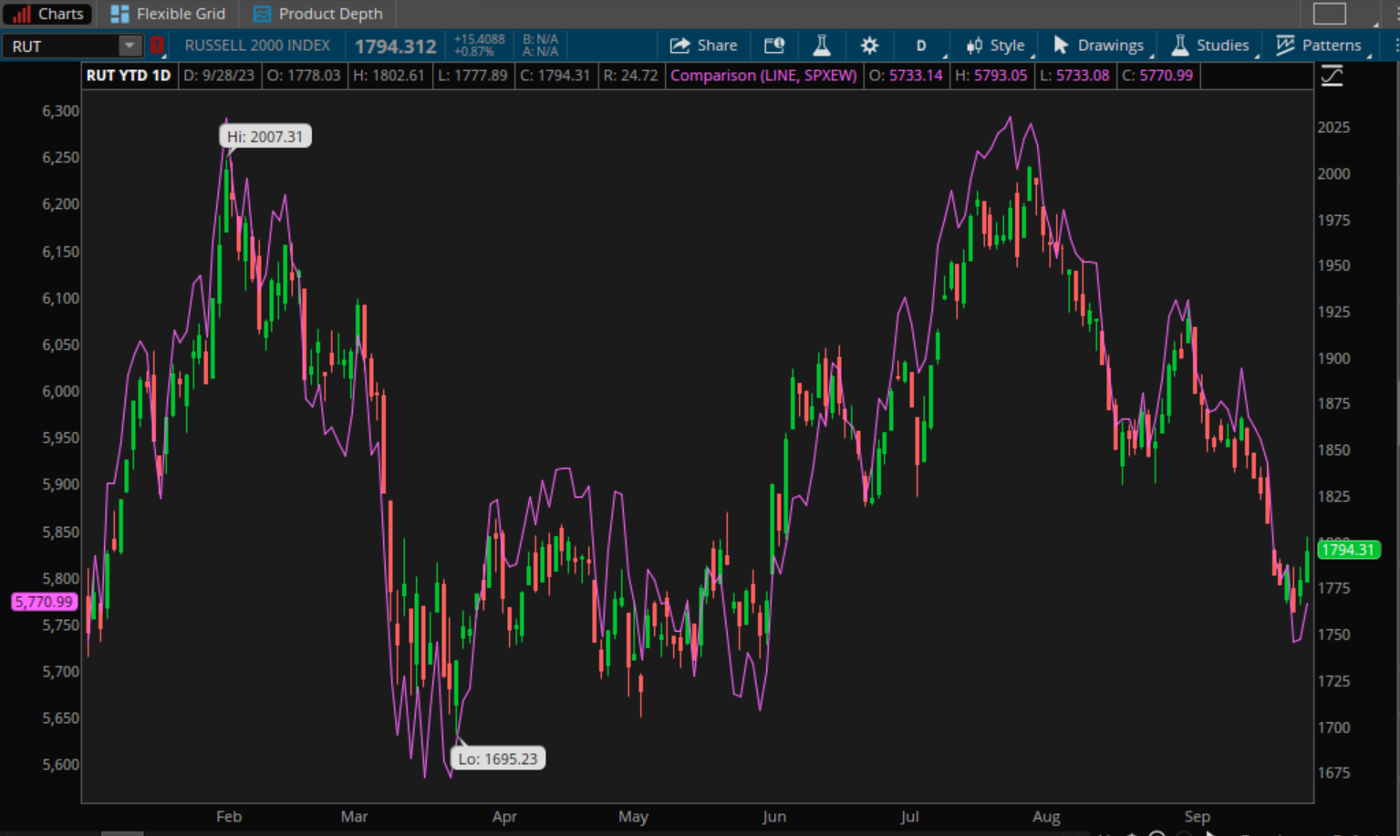
CHART OF THE DAY: BIRDS OF A FEATHER. The Russell 2000 (RUT-candlesticks) index of small-cap stocks and the Equal Weight S&P 500 (SPXEW-purple line) are both barely up for the year, versus an 11% gain year-to-date for the S&P 500 Index (SPX). Most major rallies in the past have featured more breadth (the SPX performance is dominated by the eight biggest names in the index) and participation from small-caps. Data sources: S&P Dow Jones Indices, FTSE Russell. Chart source: The thinkorswim® platform from TD Ameritrade. For illustrative purposes only. Past performance does not guarantee future results.
Thinking cap
Ideas to mull as you trade or invest
Price relief: It’s no secret the Fed is concerned about the long-term inflationary impact of higher crude oil, but crude is one of many industrial commodities, some of which are on the downswing. Copper, gasoline, lithium, steel, iron ore, and silver are among commodities moving lower over the last week, along with the CRB Commodity Index (CRB) as a whole. On the consumer side, many will be glad to hear coffee prices recently cooled, falling sharply over the last week, while chocolate fans can rejoice in lower prices for cocoa. Home builders might benefit from lumber coming off its summer peaks. Though the CRB is up over the last month thanks in part to climbing crude, many key commodities are in the red over that time. It’s a trend worth watching that implies possible relief for companies as they source from the wholesale market, which ultimately could play into improved margins if commodity prices weaken further.
Weekend fireworks: The approach of a new month means data is coming from across the Pacific. China’s official September NBS Manufacturing PMI is due out tonight U.S. time, and analysts expect a reading of 50 on the dot, Trading Economics says. Anything below that would indicate contraction. The previous number was 49.7. Caixin China General Manufacturing data is due out Saturday night, U.S time, and the average estimate is 51.2, up from 51.0 the prior month. If the Chinese figures this weekend meet expectations, it might signal more rumblings of a recovery in that struggling economy, perhaps boosting sentiment in U.S. and European markets. That might be especially true for certain sectors like technology and agriculture—industries where China is a large importer.
Keep an eye on RSI: The market’s sudden surge Wednesday afternoon from four-month lows initially surprised some participants, as no key technical level got triggered and news was thin. One possible cause stemmed from the Relative Strength Index (RSI), a momentum indicator that compares the magnitude of recent gains to the magnitude of recent losses on a scale from zero to 100. More precisely, RSI measures the price relative to the security’s or index’s own past performance. It’s calculated by taking the average of the closes of the up bars and dividing them by the average of the closes of the down bars. Generally, an RSI of 70 or above is considered overbought, and 30 or less is considered oversold. “What happened Wednesday afternoon was that the RSI on the SPX dipped below the 30 level and the VIX approached an area it has backed off from over the past six months near 19–20, which might have caused some of the bounce back,” says Nathan Peterson, director of derivatives analysis at the Schwab Center for Financial Research. “The VIX is not a very good harbinger of an impending sell-off, but it can be a good indicator of when we get too oversold on a near-term basis; when the VIX spikes to elevated levels it can hint at an impending mean-reversion bounce in stocks.”
Calendar
Oct. 2: September ISM Manufacturing Index and August Construction Spending.
Oct. 3: August Job Openings and Labor Turnover (JOLTS).
Oct. 4: September ISM Non-Manufacturing Index and August Factory Orders.
Oct. 5: August Trade Balance and expected earnings from Conagra (CAG).
Oct. 6: September Nonfarm Payrolls.
TD Ameritrade® commentary for educational purposes only. Member SIPC.
Image sourced from Shutterstock
This post contains sponsored content. This content is for informational purposes only and not intended to be investing advice.
Edge Rankings
Price Trend
© 2025 Benzinga.com. Benzinga does not provide investment advice. All rights reserved.
Trade confidently with insights and alerts from analyst ratings, free reports and breaking news that affects the stocks you care about.

