


This post contains sponsored advertising content. This content is for informational purposes only and not intended to be investing advice.
(Monday Market Close) The S&P 500 (SPX) broke the 4,300 support level that had been in place since July 2021 and tested it a few times after WTI crude oil futures spiked over the weekend—trading as high as $130 per barrel—as an increasing number of companies are choosing not to buy Russian oil. However, oil prices retreated to $120.10, which was still 3.8% higher than the closing price on Friday.
Rising oil prices helped the energy sector to be one of two sectors in the green on Monday. Investors appeared to favor the defensive nature of utilities overall because the Utilities Select Sector Index rose 1.31%. Treasuries also benefited from investors searching for safe havens because the 10-year Treasury yield (TNX) fell 1.57%. A third safe haven appeared to be gold. Gold futures rallied 1.81%, moving back above $2,000 and returning to August 2020 highs.
Fear and uncertainty continue to rise, causing the Cboe Market Volatility Index (VIX) to rise more than 11%. Fear is high enough that initial public offerings (IPOs) are disappearing. January had a record number of cancellations at 22. Currently, there are no IPOs listed on the Nasdaq IPO Calendar for any American exchange in March or going forward.
Commodity Conundrum
Oil was not the only petroleum product to spike. RBOB gasoline futures rallied more than 10% over the weekend but gave back most of its gains and closed just 1.17% higher on the day. Heating oil futures closed 4.82% higher despite reaching nearly 13% higher Sunday evening.
The reasons for the spikes are that many private companies are refusing to buy Russian oil and the United States and European allies are considering bans on Russian commodities, according to U.S. Secretary of State Antony Blinken. Previously, these groups have avoided bans on Russian commodities because of how these embargos could hurt consumers already struggling under the weight of pandemic-related inflation.
Embargos on oil could be quite expensive, and it’s causing some analysts to change their projections. Analysts from Bank of America BAC said if Russia’s 5 million barrels per day were to end, oil prices could rise to $200. JP Morgan JPM analysts are forecasting oil prices at $185 per barrel this year. Analysts from Mitsubishi UFJ Financial Groups MUFG were projecting oil at $180 per barrel and added, if that price was reached, it would probably cause a global recession.
Expensive oil is also weighing down economic forecasts. The CNBC Rapid Update shows that the median forecast for the U.S. gross domestic product (GDP) for Q1 is just 0.5%. Strategists and analysts from Citi C, UBS UBSG, Yardeni Research, and Evercore ISI have all lowered their U.S. equity outlook because of the Russian-Ukrainian conflict. Additionally, the AMEX Airline Index XAL fell 13.27% on Monday as investors considering the higher cost of fuel decide to sell shares in airlines.
Government officials are hoping that reduced sanctions on Iran and Venezuela will get more oil supplies to market and help alleviate some of the pricing pressures. Additionally, Republicans are pressuring President Joe Biden to repeal some of his executive orders signed when he first came into office. These orders banned some offshore drilling as well as some drilling on public lands.
Outside of petroleum products, grain commodities are also seeing large rallies that are leading to lock-limit events. Wheat futures shot up 7% on Monday’s open and immediately hit its sixth lock-limit event in a row. Wheat is up 72% from its February low. Grain manufacturer Archer-Daniels-Midland ADM rallied more than 1% on the news and is up more than 13% from its February low.
Interest in Rates
Rising inflation and falling economic forecasts has rekindled talk of stagflation. Stagflation is the economic phenomenon where a country sees rising inflation despite a slow economy. The United States experienced stagflation in the late 1970s, which resulted in the Fed hiking the overnight rate to 20% in the early 1980s.
The Consumer Price Index (CPI), which measures inflation, comes out on Thursday and will provide important inflation information in preparation for next week’s Federal Reserve interest rate decision. After Fed Chairman Jerome Powell told Congress last week that he favored a quarter-point hike, the market has adjusted its expectations accordingly. The market is also confident that another hike will come in May, but the picture is increasingly unclear because of the Russian-Ukraine conflict.
Looking at individual stocks, Bed Bath & Beyond (BBBY) jumped more than 35% on Monday because of the news that GameStop (GME) chairman and Chewy CHWY co-founder Ryan Cohen’s company, RC Ventures, took a 10% stake in the company. On Friday, Occidental Petroleum OXY was up 17.59% when news broke that Warren Buffett’s company Berkshire Hathaway (NYSE: BRK-A) had purchased a large stake in the company. At the same time, well-known activist investor Carl Icahn decided to sell his stake in OXY after three years.
Activist investors appear to be giving department store Kohl’s KSS some issues. On Monday, the company held its first every shareholder conference and laid out its plan for the future. However, the stock fell nearly 13% on the day after the company’s management chose to reject takeover offers last year in order to try to reform the company itself. Macellum Advisors and Engine Capital have been vocally skeptical of the company’s management’s ability to engineer a turnaround.
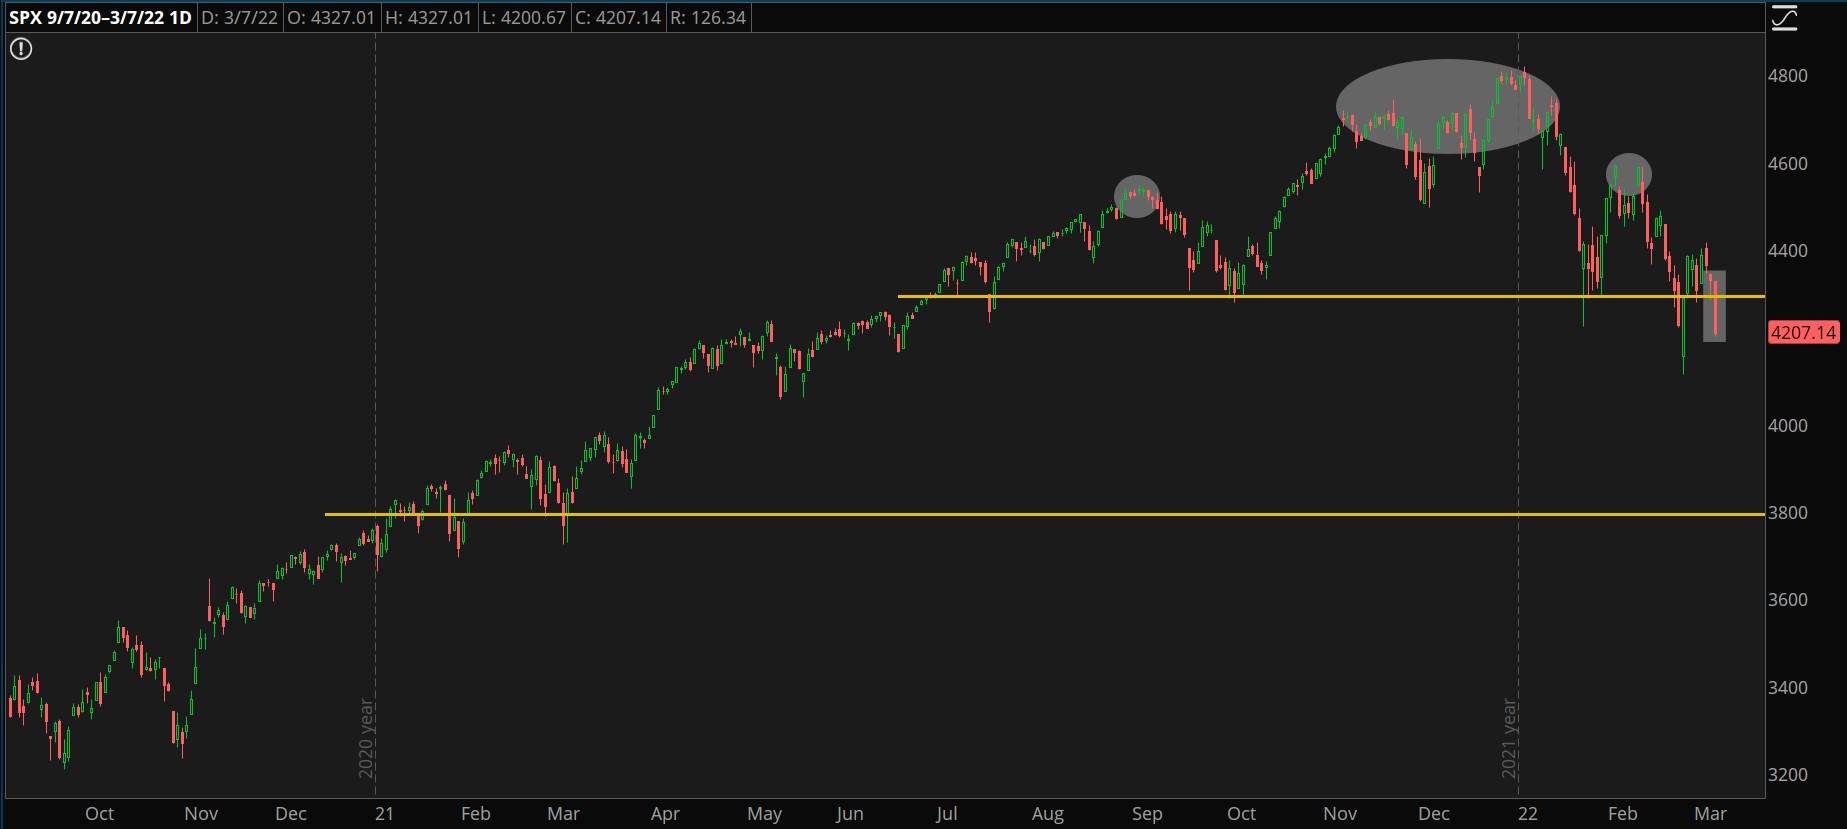
CHART OF THE DAY: HEADING THE WRONG WAY. The S&P 500 (SPX—candlesticks) appears to be forming a head and shoulders reversal pattern. The first shoulder appeared in August of 2021, the head in December 2021 and the other shoulder in February 2022. A break of support would complete the formation. Data Sources: ICE, S&P Dow Jones Indices. Chart source: The thinkorswim® platform. For illustrative purposes only. Past performance does not guarantee future results.
Head & Shoulders Below the Rest
A head and shoulders reversal pattern is considered by technical analysts to be a reversal pattern. My technical analysts friends tell me that the break of support at the 4,300 level on the S&P 500 completed the pattern. If the pattern works like technicians expect, the SPX should fall to about 3,800 over the next six months. This is calculated by measuring the difference between the top of the head to the shoulder line and then subtracting the amount from the shoulder line.
With that said, the shoulder line was broken about two weeks ago, and the bulls were able to push the index back above the line. Can the bulls stampede again?
TD Ameritrade® commentary for educational purposes only. Member SIPC.
Image sourced from Pixabay
This post contains sponsored advertising content. This content is for informational purposes only and not intended to be investing advice.
© 2024 Benzinga.com. Benzinga does not provide investment advice. All rights reserved.
Date | ticker | name | Actual EPS | EPS Surprise | Actual Rev | Rev Surprise |
|---|
Trade confidently with insights and alerts from analyst ratings, free reports and breaking news that affects the stocks you care about.

