
EUR/USD Current Price: 1.0785
- Economic downturn in Europe and the US much worse than anticipated.
- US Durable Goods Orders seen plummeting by 11.9% in March.
- EUR/USD poised to retest the year low at 1.0678.
The EUR/USD pair is ending Thursday in the red around the 1.0760 price zone, after an intense day. Macroeconomic data triggered intraday action for a change, although the numbers exposed the harm made by the ongoing pandemic on economics. The preliminary Markit estimates for April activity collapsed ar both shores of the Atlantic. The German manufacturing index fell to 34.3 while services output contracted to 15.9. For the whole Union, the manufacturing PMI resulted at 33.6, while the services index plunged to 11.7, all record lows. Also, the German GFK Consumer Confidence Survey for May plummeted to -23.4 against the previous 2.7, while the ECB announced that it would accept some junk-rated debt as collateral to mitigate the impact of possible rating downgrades.
The pair fell to 1.0755 on the back of dismal EU data, the recovering to 1.0846 as US macroeconomic releases were also quite discouraging. Initial Jobless Claims for the week ended April 17, which resulted at 4427K worse than the expected 4200K but better than the previous 5237K. The Markit preliminary estimate of the April Manufacturing PMI fell to 36.9, while the services index declined to 27, both at historical lows. The economic contraction is both economies, was blamed to the coronavirus crisis.
This Friday, Germany will publish the April IFO Survey, with the Business Climate seen down to 80 in April from 86.1 in March. The US will publish Durable Goods Orders for March, seen plunging by 11.9% and the final reading of the Michigan Consumer Sentiment Index for April foreseen at 68 vs 71 previously estimated.
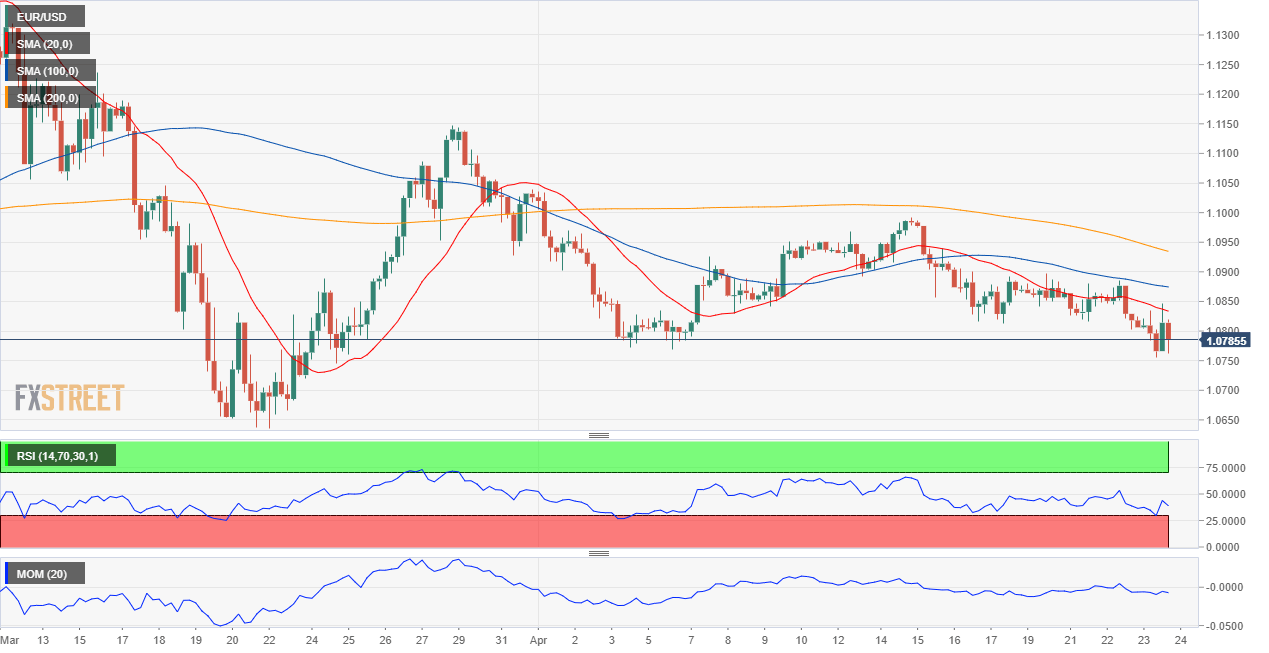
EUR/USD Short-Term Technical Outlook
The EUR/USD pair has finished the day below the 61.8% retracement of its latest daily advance at around 1.0830, with sellers rejecting attempts to advance beyond the level. The short-term picture is bearish, as, in the 4-hour chart, moving averages keep gaining downward strength above the current level, with the 20 SMA converging with the mentioned Fibonacci level. Technical indicators turned south below their midlines, but remain within familiar levels. The risk is skewed to the downside, toward the base of the range at 1.0678.
Support levels: 1.0750 1.0710 1.0680
Resistance levels: 1.0790 1.0830 1.0860
Image sourced from Pixabay
© 2024 Benzinga.com. Benzinga does not provide investment advice. All rights reserved.
Comments
Trade confidently with insights and alerts from analyst ratings, free reports and breaking news that affects the stocks you care about.

