


The daily snapping back and forth the past couple weeks could leave any investor with a neckache. A search for some sort of equilibrium continues, but we’re not there yet.
Following yesterday’s swift ride up the elevator, markets had a much weaker tone this morning as the market keeps gyrating. The pattern continues being one day up and one day down, and it’s unclear how long we’ll keep seeing these wild day-to-day percentage changes. That’s because it’s unclear how long the virus situation might last and what impact it might have on economies and companies.
At this point, it isn’t even the virus itself that’s necessarily hurting the market. It’s the ancillary reaction to the virus and the downhill impact of that. This will have a huge impact on businesses and cities. When you hear about the possibility of the NCAA tournament being played in empty stadiums, for instance, you realize the financial impact this can have. People worry about consumer spending, but when you cancel so many events, people just can’t spend. Think about all the T-shirts and caps people buy at the NCAA tournament, just as one example.
Investors are monitoring the impact of all this and re-evaluating what stocks are worth.
Hey There? Want To Delay Your Tax Filing?
The good news today is that at least you might have more time to get your taxes done. President Trump’s administration is “likely” to announce an extension to the tax filing deadline of April 15 in an effort to ease the impact of COVID-19 on businesses and households, according to the Wall Street Journal. The report indicates that the deadline extension would serve as a “bridge loan” helping to address disruptions from the virus. However, these plans aren’t final, so don’t put off your taxes at least until it becomes official.
Another news bulletin: The Bank of England cut rates by 50 basis points to 0.25%. This probably doesn’t come as much of a surprise, considering central banks all around the world have been doing the same. Meanwhile, European Central Bank (ECB) President Christine Lagarde said Europe risks a major economic shock echoing the global financial crisis and urged governments to act, Bloomberg reported. The ECB appears likely to take measures this week, according to the article.
Back home, U.S. consumer prices barely rose last month. The gain of 0.1% was lower than the 0.2% analyst consensus. More inflation numbers loom tomorrow as producer prices for February bow right before the opening bell. At this point, analysts expect the Producer Price Index to ease from its big 0.5% January gain. They forecast a 0.2% decline, according to Briefing.com.
Volatility continued to dog the market this morning, with the Cboe Volatility Index (VIX) recently registering a 53. That’s down from Monday’s 11-year high above 60, but way above levels in the low-30’s seen last week. As we’ve been saying, volatility is likely to remain high the rest of this month. Bonds rose again today, which isn’t a big surprise considering all the economic worries.
Also this morning, crude prices stepped back below $34 a barrel as it looked like Saudi Arabia might be ready to start raising production. One thing to consider watching is for any sign of Saudi Arabia and Russia entering some sort of detente in this price war now underway. At this point, weak crude appears to be a weight on the U.S. stock market (see more below).
Pendulum Shifted Direction Yesterday
The giant swings continued yesterday, but this time the pendulum tipped upward. Stocks regained about half of what they’d lost the previous day, meaning Wednesday starts with the S&P 500 Index (SPX) still in correction territory—down almost 11% for the year—but not near 20% bear territory where it nearly went Monday.
It was great to see the major indices bounce back yesterday after testing Monday’s lows. This doesn’t mean they can’t move even lower sometime soon, but it does show that at least for the moment, there might be some people buying the dip. The big thing would be if we could see two or three days in a row like that. The market hasn’t had consecutive days higher in almost a month.
Does Tuesday’s pendulum swing mean anything in the great scheme of things? Too early to say, because people have gotten used to the major indices falling and rising 3% on almost any given day. It’s likely this volatility could continue at least through next week’s Fed meeting and maybe for the rest of the month, but investors in it for the long term might want to stop paying as much attention to all the noise.
The market-moving noise on Tuesday revolved around possible fiscal stimulus, though it’s really not all that clear what people might have in mind. Some talk about taking the payroll tax to zero or extending sick leave to all employees. Others bring up the idea used by the Bush administration during 2001–2002 when the government sent every household a check.
It’s also possible Congress and the president could choose specific industries like airlines, cruise lines, and hotels and try to help them through this crisis. Judging by how the major airline stocks took off Tuesday—with double-digit gains for United UAL, Delta Air Lines Inc. DAL, and American Airlines Inc. AAL—investors seem to be counting on some government assistance for that particular segment. We’ll have to wait and see what develops. If no action comes soon, or if Congress and the White House can’t agree what to do and start squabbling, it could mean more pain for the transports and other sectors.
Markets have already baked in more Fed action. Futures put 100% odds on another rate cut next week, and the only question is how much. The end-of-the-day tally Tuesday had chances of a 50-basis point cut at 57% and odds of a 75-basis point cut at 42%. If the Fed cuts 75 points, it will have dialed rates back almost to where they were in late 2015. Those steady rate hikes from 2016–2018 seem like a long time ago.
Behemoths like the “FAANGs” are another potential barometer for market strength or weakness in these crazy times. That means Apple Inc AAPL, Alphabet GOOGL, Amazon.com, Inc. AMZN, and Netflix Inc NFLX, along with FAANG cousins like Microsoft Corporation MSFT and the chip sector. All of those showed amazing strength yesterday, but today is when the rubber meets the road, so to speak. Now is when we’ll find out if those Wall Street searchlights are ready to help lead the rest of the market out of its trough by putting two positive sessions together.
Going The Extra Mile?
There’s lots of talk that the Fed might go beyond rate cuts to stimulate the economy. That could mean “quantitative easing,” or “QE,” which is when the Fed buys securities to help keep things liquid and encourage investment by companies and consumers. If the Fed combines rate cuts with QE, it would be a signal they’re throwing everything they can at the economy to help it get through this crisis.
It also might reflect the Fed trying to get ahead of some bearish data likely to hit the market soon. The data so far haven’t really reflected the virus scare because they look too far back. By later this month, and especially by the March payrolls report early next month, data could start showing signs of economic struggle. Weak numbers are normally discouraging news, but if investors think the Fed and U.S. fiscal policymakers have their backs, maybe the numbers (which of course will be backward looking) won’t seem so scary.
We’ll probably learn a lot more next week about the Fed’s plans, but for now it’s pretty silent on that front. Not because Fed officials have nothing to say, but because the Fed is in its official “quiet period” before the meeting.
“Double Dip” Looks Constructive From A Technical Angle
The SPX’s “double dip” both Monday and again early Tuesday of levels near 2730 found buyers both times. It would take a drop to around 2700 to put the SPX into bear territory, down 20% from recent highs.
The 2730 number is arguably significant because it represents the 61.8% retracement level of the rally from the December 2018 low to the February 2020 high, and coincides with the three-year volume profile point of control level, a price level where the E-mini S&P 500 Index Futures (/ES) have traded the most number of contracts over the last three years.
The SPX is still way below all of its major daily moving averages, but it remains above the 200-week moving average, which sits just below 2700. The 2940–2955 area remains a level of possible upside resistance.
If you’re not certain about “technical support” having a lot of meaning these days, that’s understandable. It didn’t help much the last two weeks as one support level after another got blown out. That’s not uncommon when recession fears and crises like the virus come up.
Still, it can be confusing and discouraging if you’re an investor who watches those levels. One possible sign of more stability to look for would be if technical support and resistance start behaving more normally again, but no one is predicting that to happen anytime soon
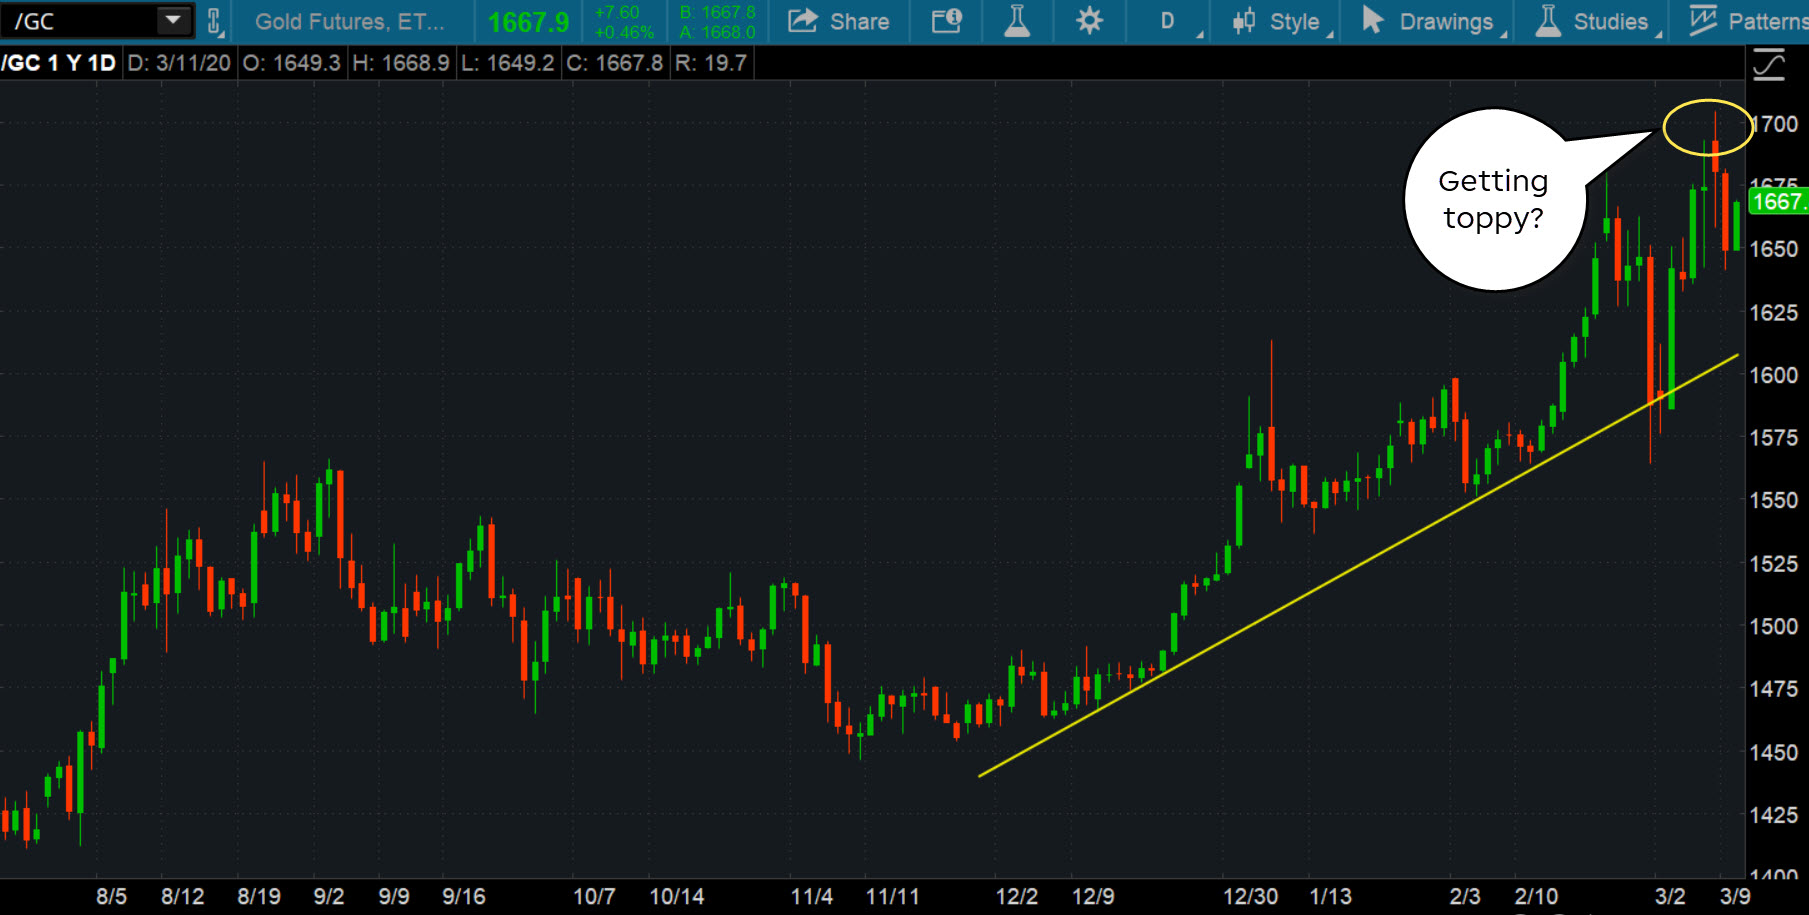
CHART OF THE DAY: GOLD MOVES CLOSE TO RESISTANCE. Gold futures (/GC–candlestick) have been trending upward relatively steeply (yellow trend line), with prices reaching a seven-year high of around $1,700 an ounce. The uptrend reflected investors seeking so-called “safe-haven” assets in these volatile markets, though no asset is really “safe.” The question now is whether gold can test the $1,700 resistance again, or if it’s getting to the point where some investors see it as overbought. Data source: CME Group. Chart source: The thinkorswim® platform from TD Ameritrade. For illustrative purposes only. Past performance does not guarantee future results.
The Problem with Cheap Gas: Crude prices below $40 a barrel mean bargains at the pump for drivers, but tend to put a lot of pressure on the U.S. shale industry. While a decade or two ago a drop in crude prices might have been seen as a boost for the economy, it’s more of a mixed picture now. Sure, it’s nice to pay less for gas, and maybe consumers will spend some of those savings elsewhere provided the virus doesn’t have a huge impact on general economic activity. However, the U.S. now is a crude exporter, selling approximately four million barrels a day to customers overseas. That means lower crude prices are now a domestic industry issue. A drop in the price of crude from $50 a barrel to $35 a barrel means approximately $60 million a day less revenue for U.S. crude exporting companies.
With that in mind, consider being watchful for possible big production drops and the chance of slower demand for workers in that industry. If this gets worse, it could start showing up in the weekly and monthly jobs reports. The first place to check for any impact is in Friday’s weekly rig count from Baker Hughes. Last week’s report showed active oil drilling rigs at 682, down from 834 a year ago.
Point of Order: The SPX is down nearly more than 10% year-to-date and nearly slipped into bear market territory Monday, but with a little perspective you can see things from a different angle. Though no one denies it’s been painful the last few weeks, sometimes it helps as a long-term investor if you can put recent losses in context of the year-in/year-out flow of the markets. For instance, the SPX is actually slightly higher now than it was a year ago, and six of 11 S&P sectors are in the green vs. then. These include double-digit gains for Information Technology and Utilities. Of course, that doesn’t necessarily bring much joy if you had big positions in Energy (down 45% from a year ago) or Financials (down 12%). Over the last five years, however, only Energy and Materials are down.
Life’s Rich Patterns: Traders love to find patterns in the charts, and some are meaningful while others are just interesting to think about. This next one probably falls in the latter category, but you never know. The VIX hit record lows below 10 in late 2017, just over two years ago. This week it skyrocketed above 60, its highest level since 2008. Looking for the pattern here? Consider this: Back in early 2007, VIX also hit record lows, which were followed by its move to all-time highs almost two years later. Coincidence? Probably. Then again, some traders say extremely low volatility can be a contrary indicator potentially pointing to trouble in coming years. Maybe that’s something to think about the next time VIX falls to levels below 10, though it’s very hard to imagine that happening anytime soon.
Information from TDA is not intended to be investment advice or construed as a recommendation or endorsement of any particular investment or investment strategy, and is for illustrative purposes only. Be sure to understand all risks involved with each strategy.
© 2024 Benzinga.com. Benzinga does not provide investment advice. All rights reserved.
Date | ticker | name | Actual EPS | EPS Surprise | Actual Rev | Rev Surprise |
|---|
Trade confidently with insights and alerts from analyst ratings, free reports and breaking news that affects the stocks you care about.

