


In the dynamic and cutthroat world of business, conducting thorough company analysis is essential for investors and industry experts. In this article, we will undertake a comprehensive industry comparison, evaluating Broadcom AVGO and its primary competitors in the Semiconductors & Semiconductor Equipment industry. By closely examining key financial metrics, market position, and growth prospects, our aim is to provide valuable insights for investors and shed light on company's performance within the industry.
Broadcom Background
Broadcom is the sixth-largest semiconductor company globally and has expanded into various software businesses, with over $30 billion in annual revenue. It sells 17 core semiconductor product lines across wireless, networking, broadband, storage, and industrial markets. It is primarily a fabless designer but holds some manufacturing in-house, like for its best-of-breed FBAR filters that sell into the Apple iPhone. In software, it sells virtualization, infrastructure, and security software to large enterprises, financial institutions, and governments.Broadcom is the product of consolidation. Its businesses are an amalgamation of former companies like legacy Broadcom and Avago Technologies in chips, as well as Brocade, CA Technologies, and Symantec in software.
| Company | P/E | P/B | P/S | ROE | EBITDA (in billions) | Gross Profit (in billions) | Revenue Growth |
|---|---|---|---|---|---|---|---|
| Broadcom Inc | 31.21 | 20.04 | 12.27 | 15.3% | $5.3 | $6.41 | 4.72% |
| NVIDIA Corp | 61.51 | 34.62 | 25.87 | 30.42% | $10.96 | $13.4 | 205.51% |
| Taiwan Semiconductor Manufacturing Co Ltd | 18.88 | 4.92 | 7.62 | 6.46% | $392.33 | $296.64 | -10.83% |
| Advanced Micro Devices Inc | 1222.36 | 3.95 | 9.87 | 0.54% | $1.13 | $2.75 | 4.22% |
| Qualcomm Inc | 20.88 | 7.02 | 4.28 | 7.05% | $2.06 | $4.75 | -24.26% |
| Texas Instruments Inc | 20.72 | 8.74 | 8.09 | 10.44% | $2.34 | $2.81 | -13.53% |
| Analog Devices Inc | 29.03 | 2.65 | 7.82 | 1.39% | $1.18 | $1.65 | -16.36% |
| ARM Holdings PLC | 369.60 | 13.94 | 23.44 | -2.45% | $-0.12 | $0.76 | 27.94% |
| Microchip Technology Inc | 19.50 | 6.90 | 5.49 | 9.66% | $1.1 | $1.53 | 8.74% |
| STMicroelectronics NV | 10.40 | 2.82 | 2.62 | 7.28% | $1.69 | $2.11 | 2.55% |
| ON Semiconductor Corp | 16.01 | 4.57 | 4.28 | 8.05% | $0.87 | $1.03 | -0.54% |
| GLOBALFOUNDRIES Inc | 21.79 | 2.84 | 4.03 | 2.34% | $0.64 | $0.53 | -10.7% |
| United Microelectronics Corp | 8.92 | 1.78 | 2.63 | 4.72% | $29.0 | $20.46 | -24.3% |
| ASE Technology Holding Co Ltd | 16.50 | 2.05 | 1.01 | 3.06% | $28.07 | $24.92 | -18.27% |
| Skyworks Solutions Inc | 17.41 | 2.81 | 3.58 | 4.09% | $0.4 | $0.48 | -13.37% |
| First Solar Inc | 33.06 | 2.48 | 4.95 | 4.35% | $0.37 | $0.38 | 27.37% |
| Lattice Semiconductor Corp | 42.02 | 14.08 | 12.04 | 8.96% | $0.07 | $0.13 | 11.4% |
| Universal Display Corp | 41.50 | 6.13 | 14.50 | 3.77% | $0.06 | $0.11 | -12.13% |
| Rambus Inc | 26.05 | 7.68 | 16.32 | 10.86% | $0.12 | $0.08 | -6.19% |
| MACOM Technology Solutions Holdings Inc | 68.55 | 6.66 | 9.68 | 2.63% | $0.05 | $0.09 | -15.59% |
| Allegro Microsystems Inc | 21.03 | 4.80 | 4.97 | 6.18% | $0.09 | $0.16 | 15.92% |
| Average | 104.29 | 7.07 | 8.65 | 6.49% | $23.62 | $18.74 | 6.88% |
When closely examining Broadcom, the following trends emerge:
-
With a Price to Earnings ratio of 31.21, which is 0.3x less than the industry average, the stock shows potential for growth at a reasonable price, making it an interesting consideration for market participants.
-
The elevated Price to Book ratio of 20.04 relative to the industry average by 2.83x suggests company might be overvalued based on its book value.
-
The stock's relatively high Price to Sales ratio of 12.27, surpassing the industry average by 1.42x, may indicate an aspect of overvaluation in terms of sales performance.
-
The company has a higher Return on Equity (ROE) of 15.3%, which is 8.81% above the industry average. This suggests efficient use of equity to generate profits and demonstrates profitability and growth potential.
-
The Earnings Before Interest, Taxes, Depreciation, and Amortization (EBITDA) of $5.3 Billion is 0.22x below the industry average, suggesting potential lower profitability or financial challenges.
-
The company has lower gross profit of $6.41 Billion, which indicates 0.34x below the industry average. This potentially indicates lower revenue after accounting for production costs.
-
The company is witnessing a substantial decline in revenue growth, with a rate of 4.72% compared to the industry average of 6.88%, which indicates a challenging sales environment.
Debt To Equity Ratio

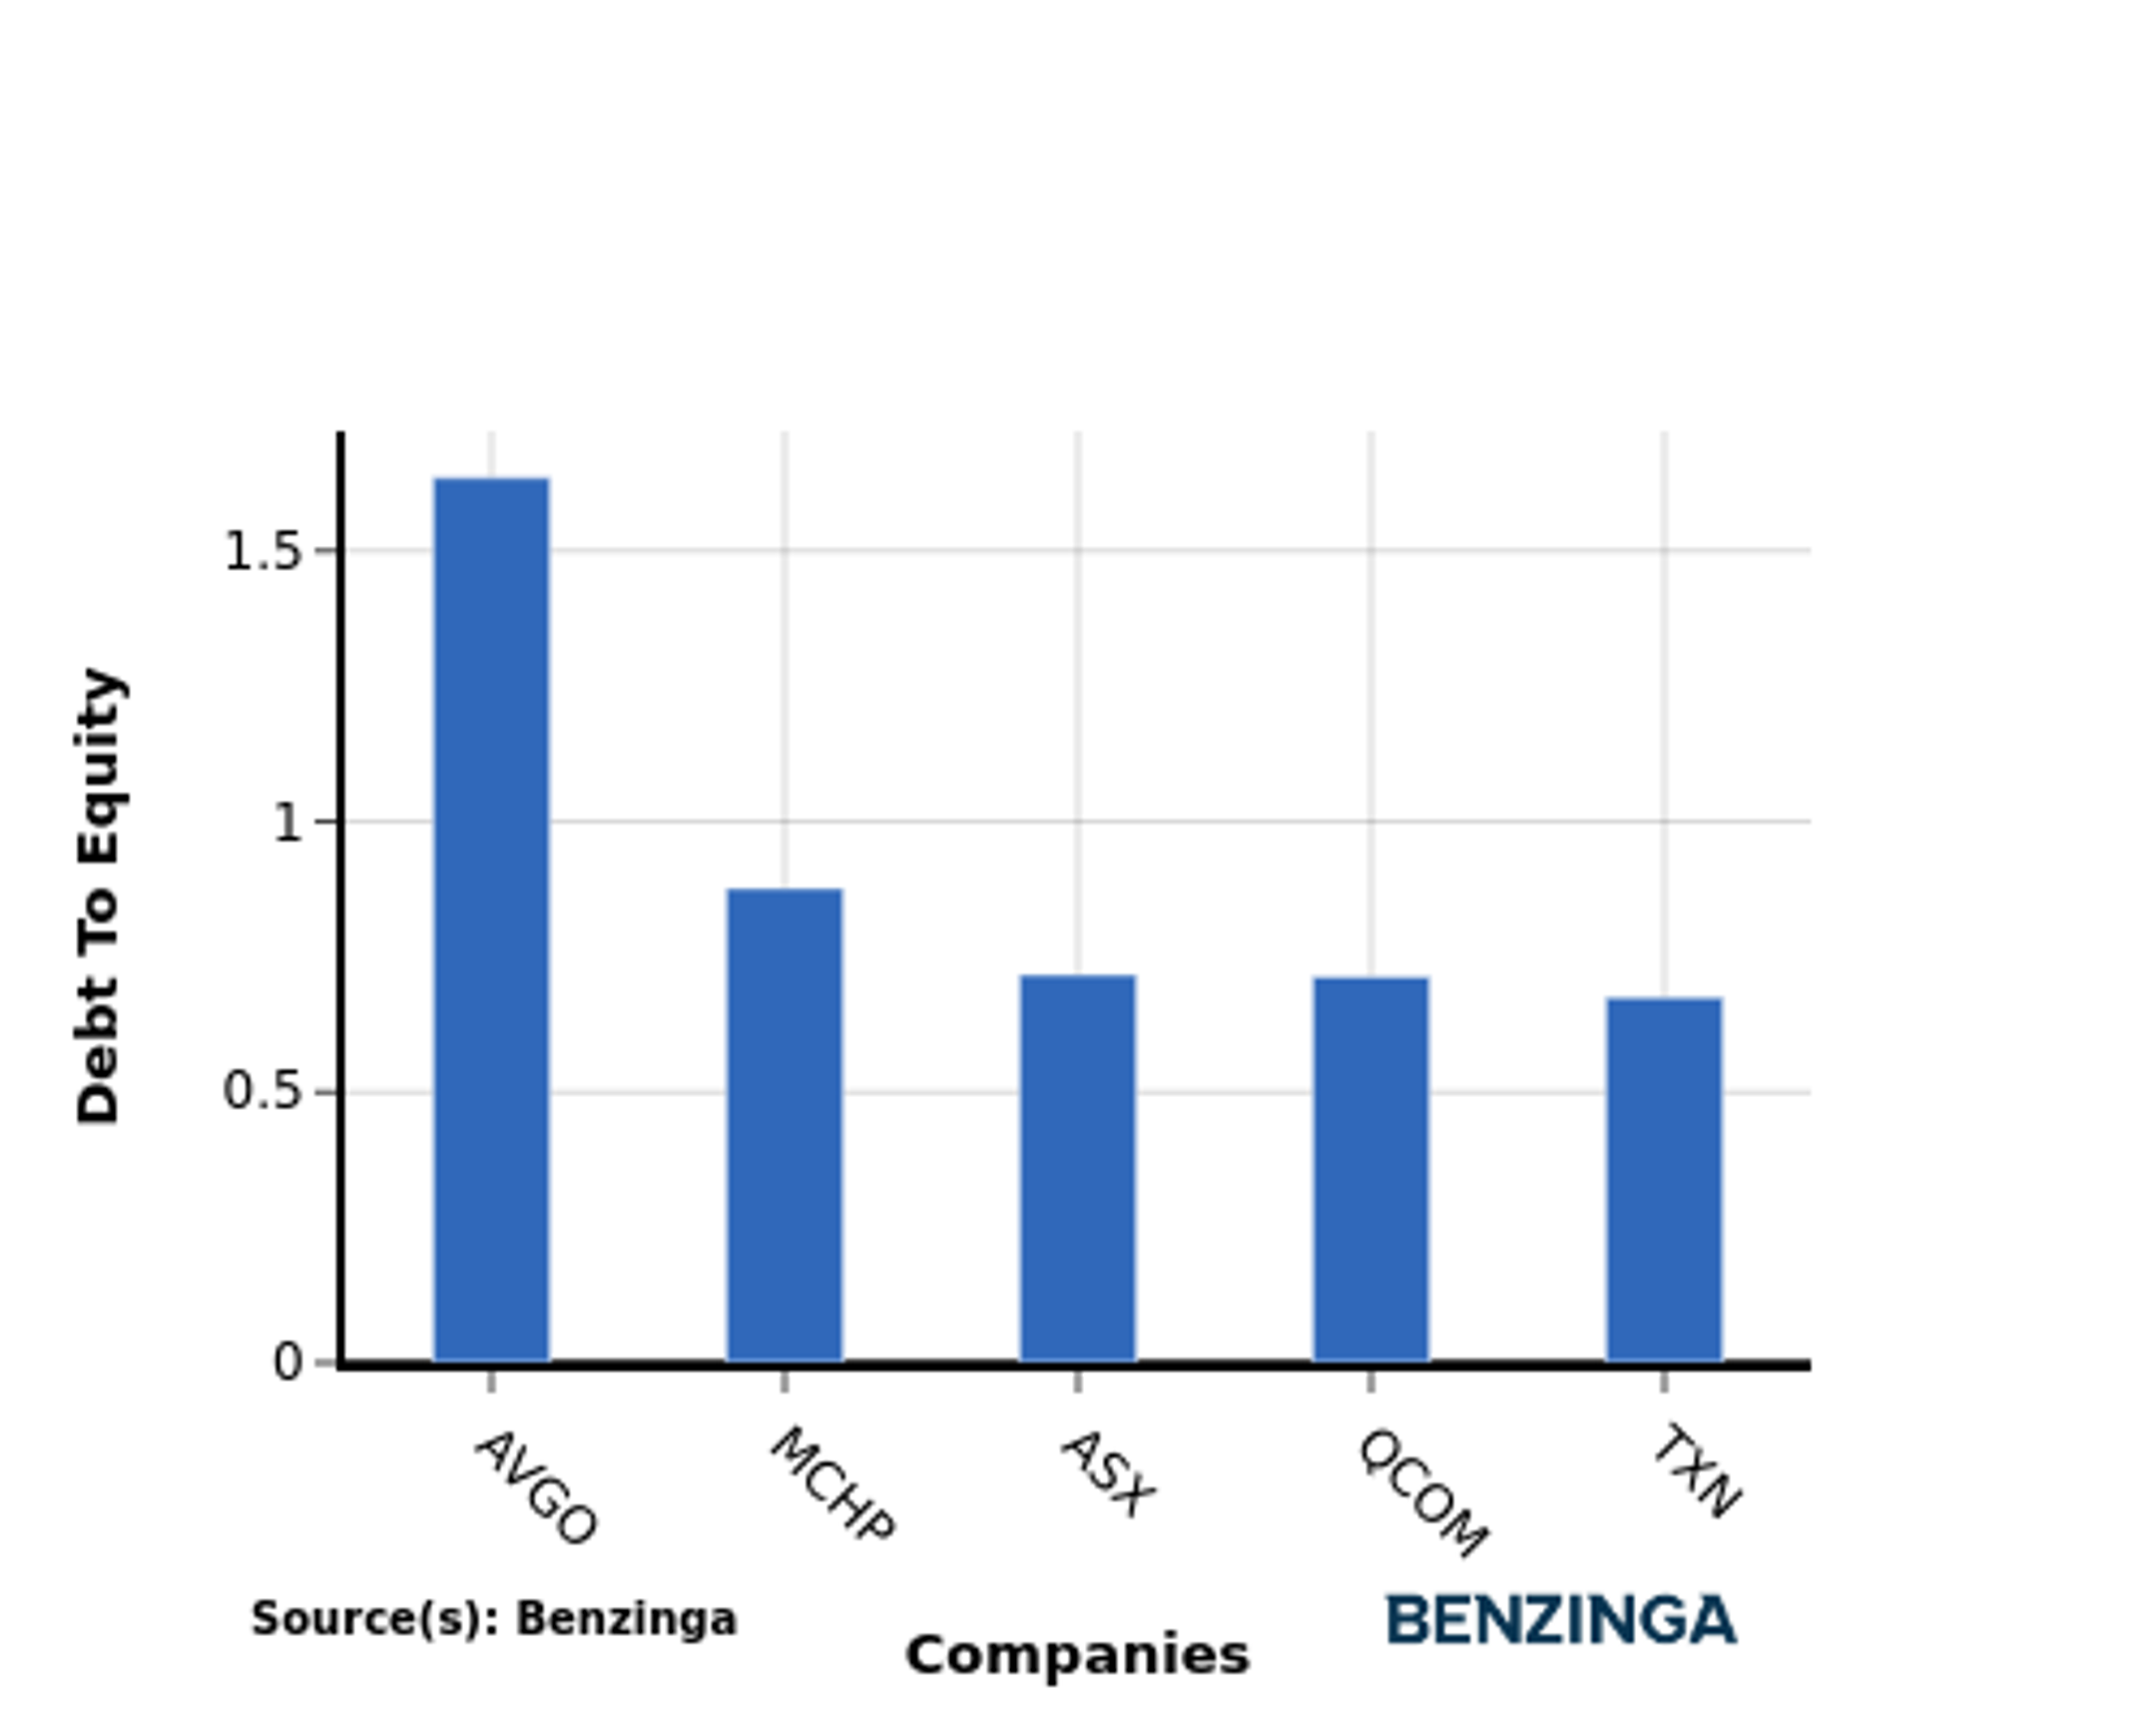
The debt-to-equity (D/E) ratio provides insights into the proportion of debt a company has in relation to its equity and asset value.
Considering the debt-to-equity ratio in industry comparisons allows for a concise evaluation of a company's financial health and risk profile, aiding in informed decision-making.
When assessing Broadcom against its top 4 peers using the Debt-to-Equity ratio, the following comparisons can be made:
-
Broadcom exhibits a relatively higher debt-to-equity ratio of 1.64 compared to its top 4 peers, suggesting a higher proportion of debt in the company's capital structure.
-
This higher level of debt can pose greater financial risk.
Key Takeaways
Broadcom's low PE ratio suggests that it may be undervalued compared to its peers in the Semiconductors & Semiconductor Equipment industry. However, its high PB and PS ratios indicate that the market may be overvaluing the company's assets and sales. On the other hand, Broadcom's high ROE suggests that it is generating strong returns on shareholder equity. Its low EBITDA, gross profit, and revenue growth indicate potential weaknesses in its financial performance compared to industry peers.
This article was generated by Benzinga's automated content engine and reviewed by an editor.
© 2024 Benzinga.com. Benzinga does not provide investment advice. All rights reserved.
Trade confidently with insights and alerts from analyst ratings, free reports and breaking news that affects the stocks you care about.

