


In today's rapidly evolving and fiercely competitive business landscape, it is crucial for investors and industry analysts to conduct comprehensive company evaluations. In this article, we will undertake an in-depth industry comparison, assessing CSX CSX alongside its primary competitors in the Road & Rail industry. By meticulously examining crucial financial indicators, market positioning, and growth potential, we aim to provide valuable insights to investors and shed light on company's performance within the industry.
CSX Background
Operating in the Eastern United States, Class I railroad CSX generated revenue near $14.8 billion in 2022. On its more than 21,000 miles of track, CSX hauls shipments of coal (16% of consolidated revenue), chemicals (17%), intermodal containers (16%), automotive cargo (7%), and a diverse mix of other bulk and industrial merchandise.
| Company | P/E | P/B | P/S | ROE | EBITDA (in billions) | Gross Profit (in billions) | Revenue Growth |
|---|---|---|---|---|---|---|---|
| CSX Corp | 16.46 | 5.14 | 4.32 | 6.99% | $1.73 | $1.29 | -8.29% |
| Union Pacific Corp | 20.70 | 9.39 | 5.46 | 11.24% | $2.86 | $2.56 | -9.52% |
| Norfolk Southern Corp | 22.36 | 3.66 | 3.79 | 3.78% | $1.12 | $1.03 | -11.13% |
| Average | 21.53 | 6.53 | 4.62 | 7.51% | $1.99 | $1.79 | -10.32% |
After examining CSX, the following trends can be inferred:
-
The stock's Price to Earnings ratio of 16.46 is lower than the industry average by 0.76x, suggesting potential value in the eyes of market participants.
-
Considering a Price to Book ratio of 5.14, which is well below the industry average by 0.79x, the stock may be undervalued based on its book value compared to its peers.
-
Based on its sales performance, the stock could be deemed undervalued with a Price to Sales ratio of 4.32, which is 0.94x the industry average.
-
The Return on Equity (ROE) of 6.99% is 0.52% below the industry average, suggesting potential inefficiency in utilizing equity to generate profits.
-
Compared to its industry, the company has lower Earnings Before Interest, Taxes, Depreciation, and Amortization (EBITDA) of $1.73 Billion, which is 0.87x below the industry average, potentially indicating lower profitability or financial challenges.
-
With lower gross profit of $1.29 Billion, which indicates 0.72x below the industry average, the company may experience lower revenue after accounting for production costs.
-
The company's revenue growth of -8.29% exceeds the industry average of -10.32%, indicating strong sales performance and market outperformance.
Debt To Equity Ratio

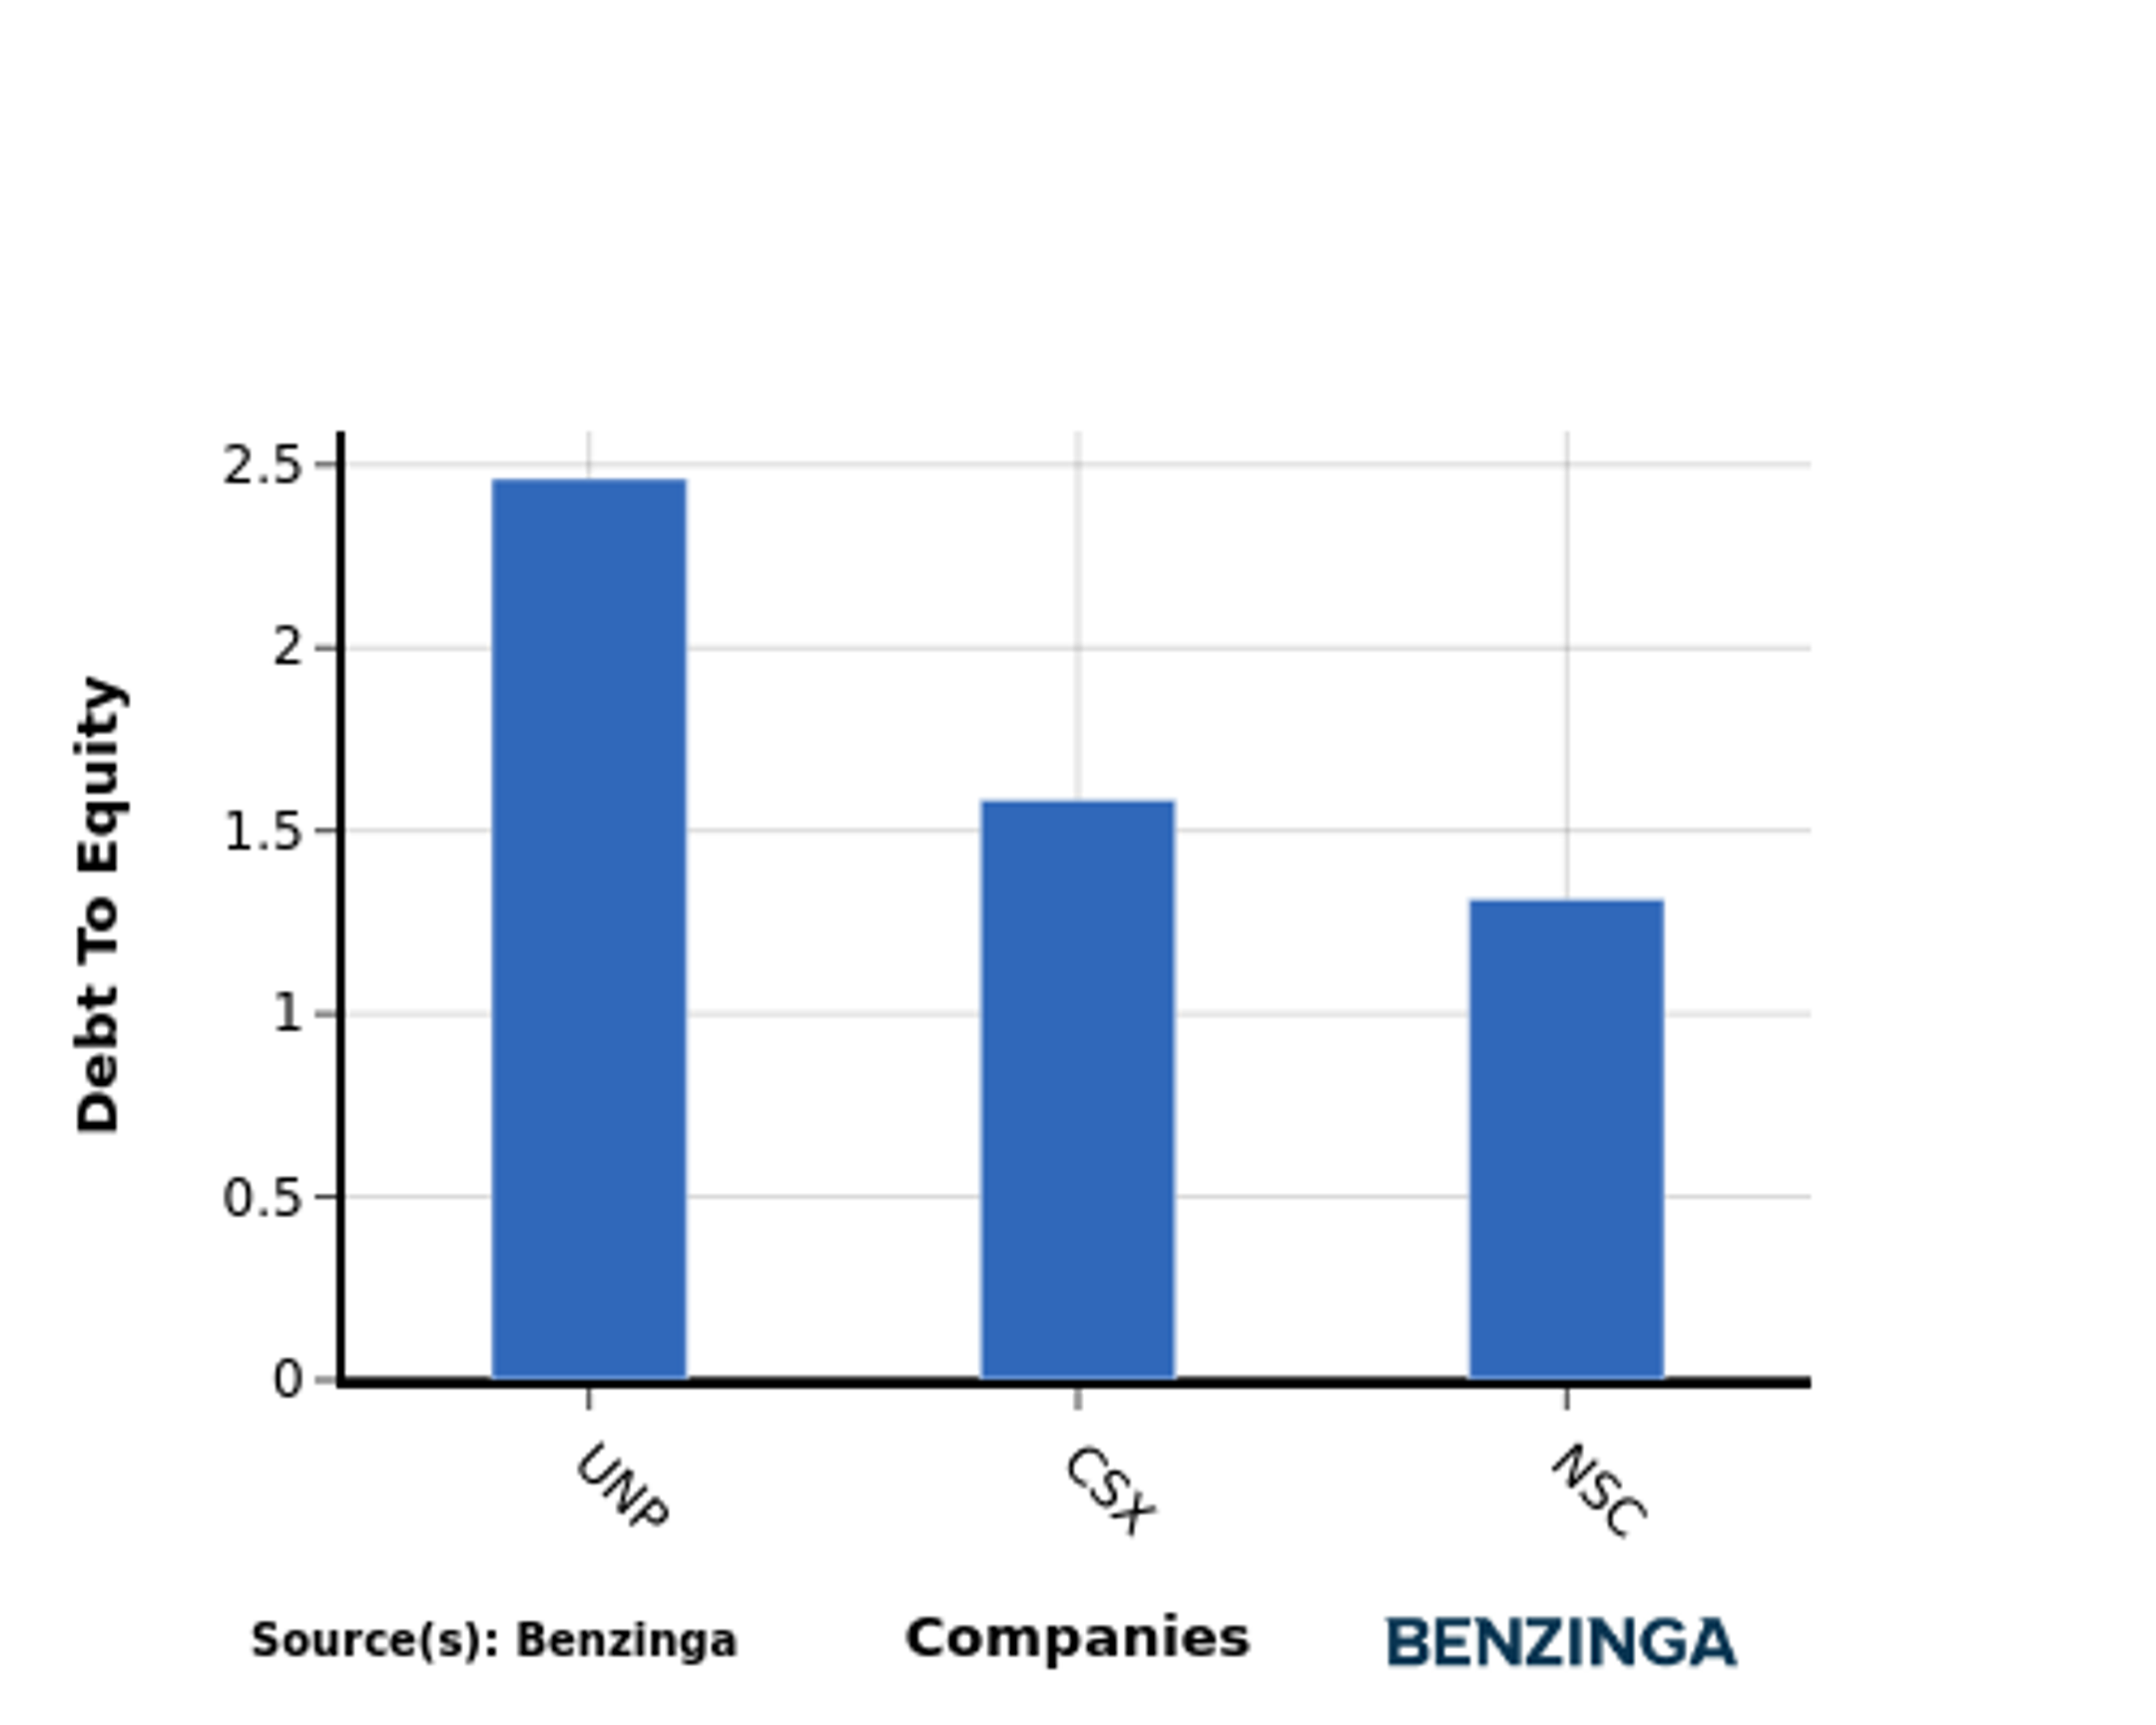
The debt-to-equity (D/E) ratio measures the financial leverage of a company by evaluating its debt relative to its equity.
Considering the debt-to-equity ratio in industry comparisons allows for a concise evaluation of a company's financial health and risk profile, aiding in informed decision-making.
In light of the Debt-to-Equity ratio, a comparison between CSX and its top 4 peers reveals the following information:
-
Among its top 4 peers, CSX is placed in the middle with a moderate debt-to-equity ratio of 1.59.
-
This implies a balanced financial structure, with a reasonable proportion of debt and equity.
Key Takeaways
The valuation analysis for CSX in the Road & Rail industry indicates that its PE, PB, and PS ratios are low compared to its peers. This suggests that CSX may be undervalued in terms of its earnings, book value, and sales. On the other hand, CSX's low ROE, EBITDA, and gross profit ratios indicate lower profitability compared to its peers. However, CSX's high revenue growth ratio suggests potential for future growth in the industry.
This article was generated by Benzinga's automated content engine and reviewed by an editor.
© 2024 Benzinga.com. Benzinga does not provide investment advice. All rights reserved.
Trade confidently with insights and alerts from analyst ratings, free reports and breaking news that affects the stocks you care about.

