


In today's fast-paced and competitive business landscape, it is essential for investors and industry enthusiasts to thoroughly analyze companies before making investment decisions. In this article, we will conduct a comprehensive industry comparison, evaluating CDW CDW against its key competitors in the Electronic Equipment, Instruments & Components industry. By examining key financial metrics, market position, and growth prospects, we aim to provide valuable insights for investors and shed light on company's performance within the industry.
CDW Background
CDW Corp is a value-added reseller operating in the U.S. (95% of sales) and Canada (5%). The company has more than 100,000 products on its line of cards that range from notebooks to data center software. Roughly half of CDW's revenue comes from midsize and large businesses, with the remaining from small businesses, government agencies, education institutions, and health-care organizations.
| Company | P/E | P/B | P/S | ROE | EBITDA (in billions) | Gross Profit (in billions) | Revenue Growth |
|---|---|---|---|---|---|---|---|
| CDW Corp | 26.15 | 15.50 | 1.31 | 18.43% | $0.54 | $1.23 | -9.45% |
| TD Synnex Corp | 13.69 | 1.02 | 0.15 | 1.66% | $0.34 | $0.97 | -9.09% |
| Arrow Electronics Inc | 6.73 | 1.19 | 0.20 | 3.59% | $0.38 | $0.98 | -13.59% |
| Insight Enterprises Inc | 20.35 | 2.96 | 0.58 | 3.77% | $0.11 | $0.41 | -3.55% |
| Avnet Inc | 5.43 | 0.87 | 0.17 | 4.37% | $0.38 | $0.75 | -3.34% |
| ePlus Inc | 13.24 | 2.15 | 0.79 | 4.24% | $0.05 | $0.14 | 25.27% |
| PC Connection Inc | 20.15 | 1.91 | 0.55 | 3.17% | $0.04 | $0.13 | -10.65% |
| ScanSource Inc | 9.23 | 0.88 | 0.21 | 2.11% | $0.04 | $0.11 | -1.57% |
| Climb Global Solutions Inc | 16.34 | 2.92 | 0.57 | 3.52% | $0.0 | $0.01 | -4.01% |
| Richardson Electronics Ltd | 9.87 | 1.03 | 0.68 | 0.77% | $0.0 | $0.02 | -22.17% |
| Average | 12.78 | 1.66 | 0.43 | 3.02% | $0.15 | $0.39 | -4.74% |
Through a thorough examination of CDW, we can discern the following trends:
-
At 26.15, the stock's Price to Earnings ratio significantly exceeds the industry average by 2.05x, suggesting a premium valuation relative to industry peers.
-
It could be trading at a premium in relation to its book value, as indicated by its Price to Book ratio of 15.5 which exceeds the industry average by 9.34x.
-
The stock's relatively high Price to Sales ratio of 1.31, surpassing the industry average by 3.05x, may indicate an aspect of overvaluation in terms of sales performance.
-
With a Return on Equity (ROE) of 18.43% that is 15.41% above the industry average, it appears that the company exhibits efficient use of equity to generate profits.
-
The Earnings Before Interest, Taxes, Depreciation, and Amortization (EBITDA) of $540 Million is 3.6x above the industry average, highlighting stronger profitability and robust cash flow generation.
-
Compared to its industry, the company has higher gross profit of $1.23 Billion, which indicates 3.15x above the industry average, indicating stronger profitability and higher earnings from its core operations.
-
The company's revenue growth of -9.45% is significantly below the industry average of -4.74%. This suggests a potential struggle in generating increased sales volume.
Debt To Equity Ratio

The debt-to-equity (D/E) ratio provides insights into the proportion of debt a company has in relation to its equity and asset value.
Considering the debt-to-equity ratio in industry comparisons allows for a concise evaluation of a company's financial health and risk profile, aiding in informed decision-making.
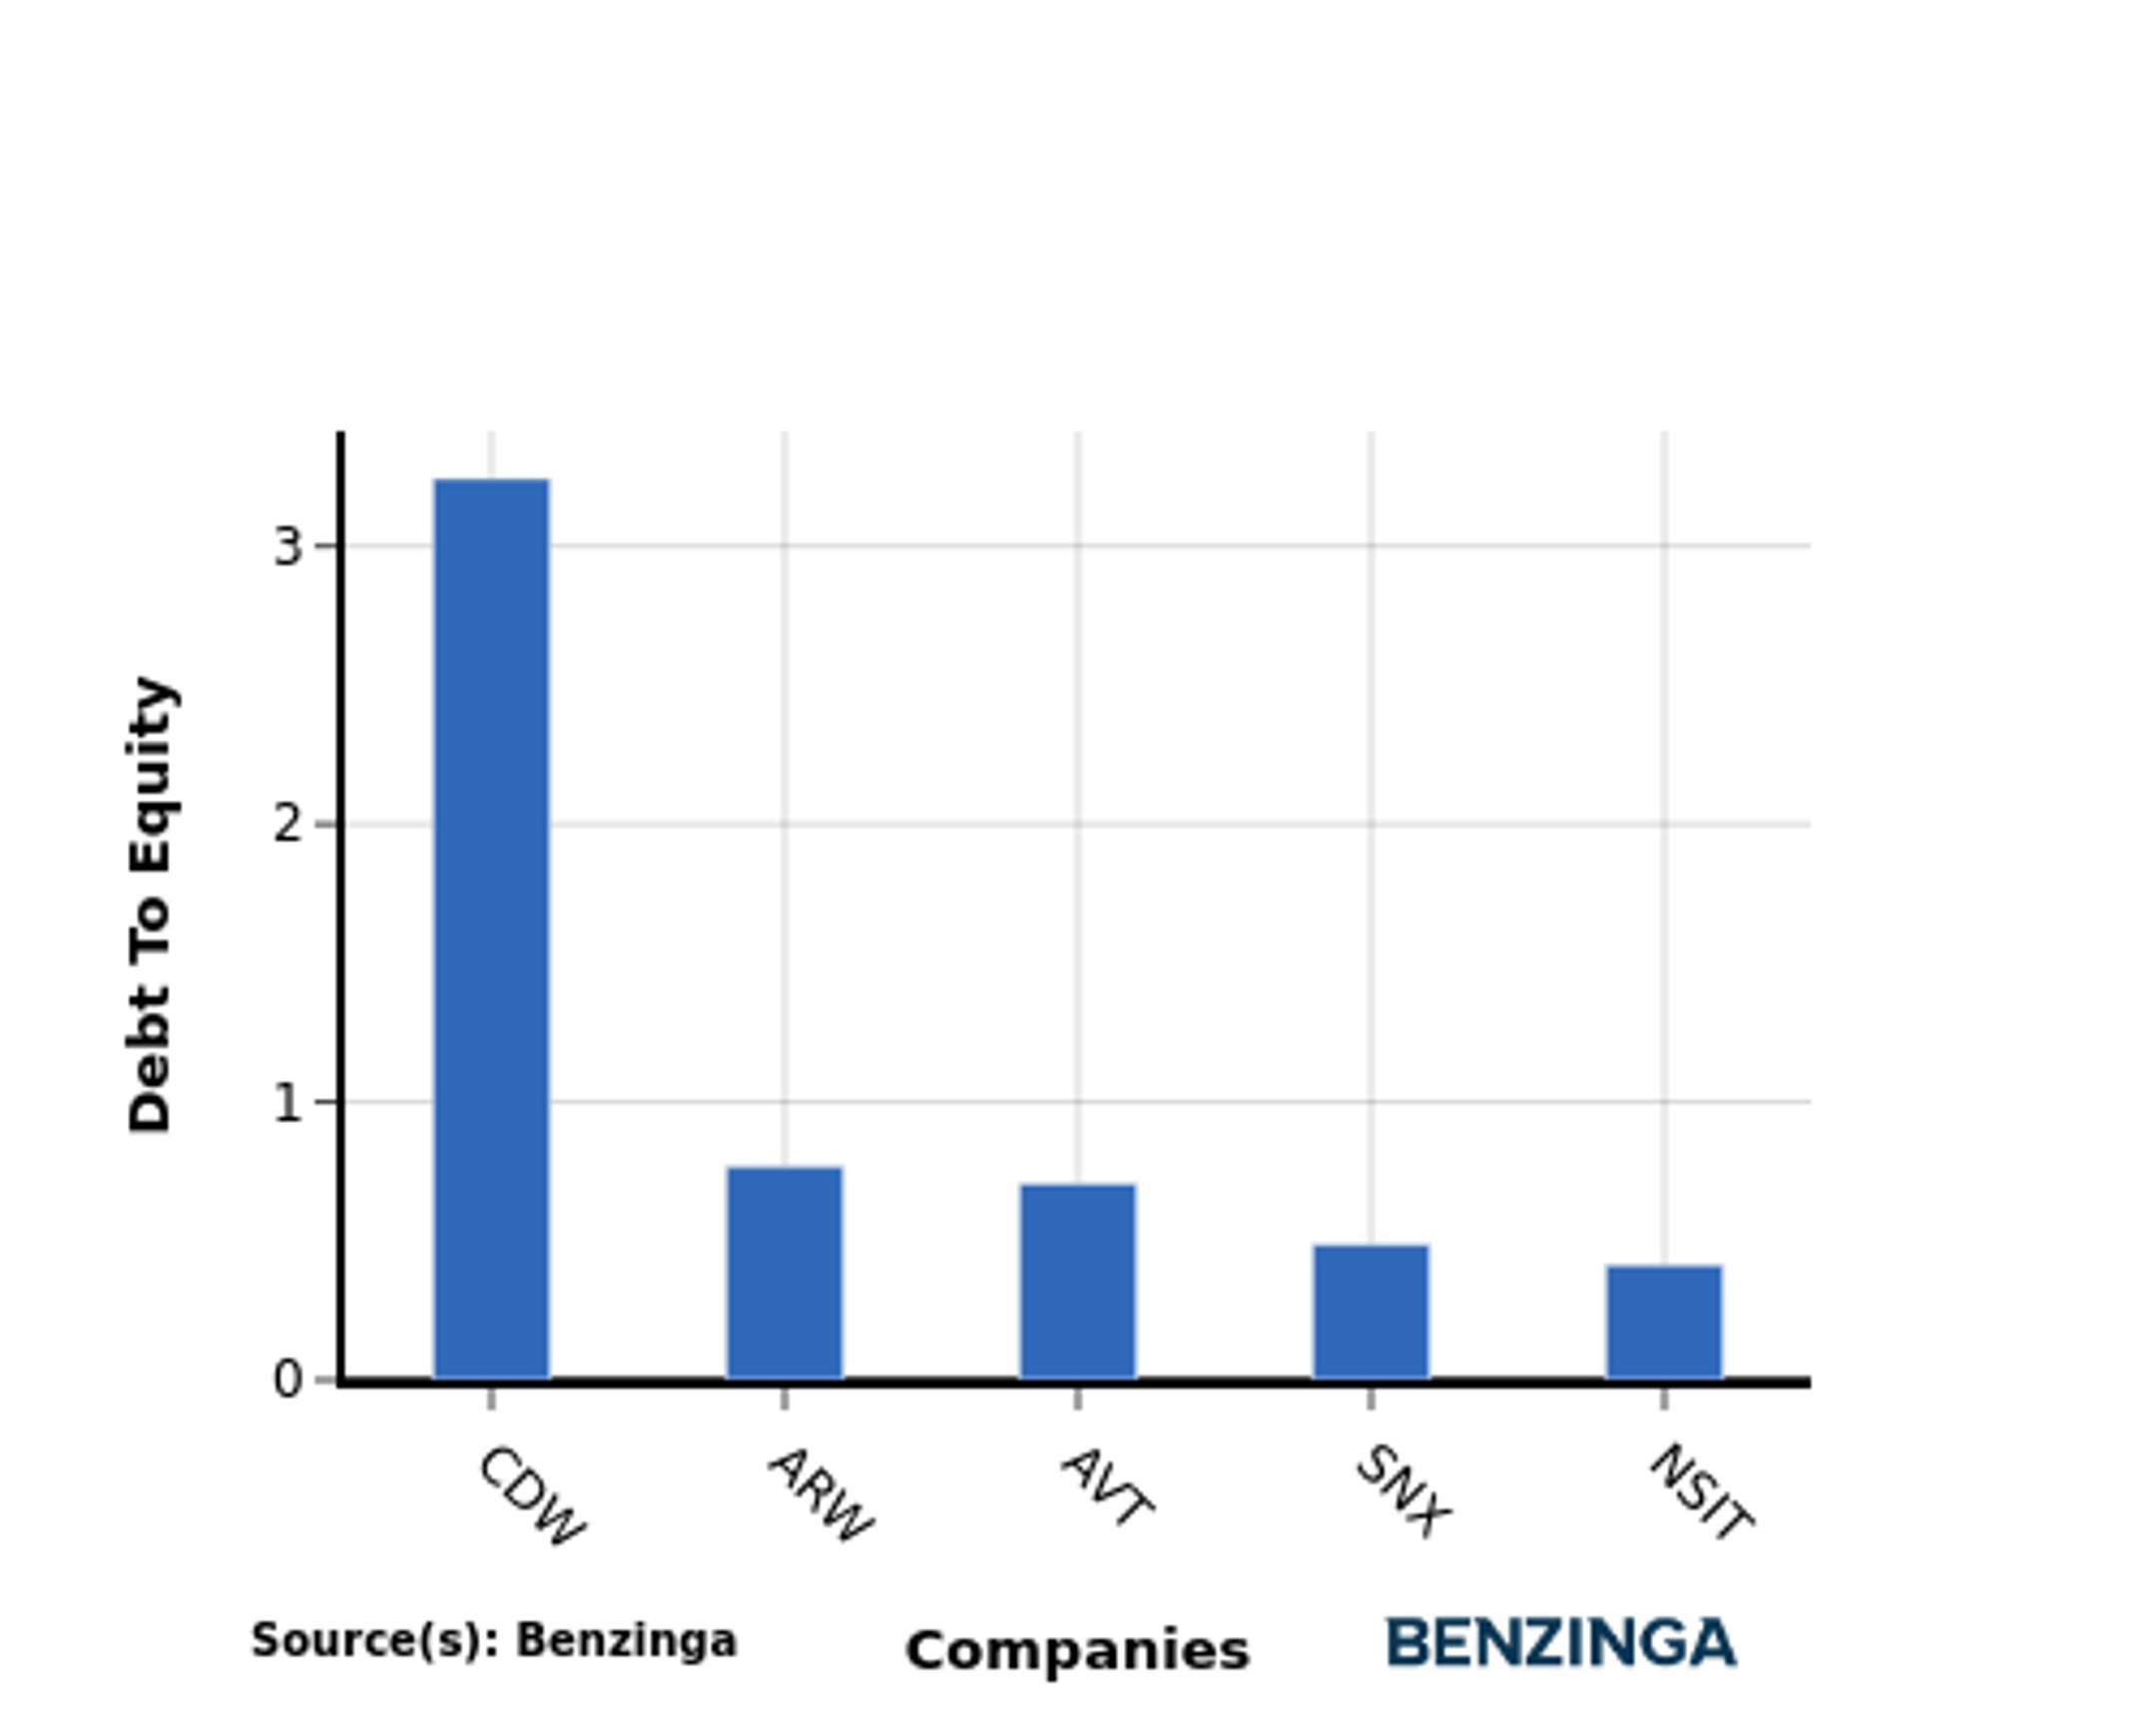
In light of the Debt-to-Equity ratio, a comparison between CDW and its top 4 peers reveals the following information:
-
Among its top 4 peers, CDW has a higher debt-to-equity ratio of 3.24.
-
This implies a greater reliance on debt financing, which can expose the company to higher financial risk and potential challenges.
Key Takeaways
CDW's high PE, PB, and PS ratios indicate that the company is trading at a premium compared to its peers in the Electronic Equipment, Instruments & Components industry. This suggests that investors are willing to pay a higher price for CDW's earnings, book value, and sales. On the other hand, CDW's high ROE, EBITDA, gross profit, and low revenue growth indicate that the company is generating strong profitability and efficiency, but its revenue growth is relatively slow compared to its peers.
This article was generated by Benzinga's automated content engine and reviewed by an editor.
© 2024 Benzinga.com. Benzinga does not provide investment advice. All rights reserved.
Trade confidently with insights and alerts from analyst ratings, free reports and breaking news that affects the stocks you care about.

