


In the ever-changing and fiercely competitive business landscape, conducting thorough company analysis is crucial for investors and industry experts. In this article, we will undertake a comprehensive industry comparison, evaluating Diamondback Energy FANG and its primary competitors in the Oil, Gas & Consumable Fuels industry. By closely examining key financial metrics, market position, and growth prospects, our aim is to provide valuable insights for investors and shed light on company's performance within the industry.
Diamondback Energy Background
Diamondback Energy is an independent oil and gas producer in the United States. The company operates exclusively in the Permian Basin. At the end of 2022, the company reported net proven reserves of 2 billion barrels of oil equivalent. Net production averaged about 386,000 barrels per day in 2022, at a ratio of 58% oil, 21% natural gas liquids, and 21% natural gas.
| Company | P/E | P/B | P/S | ROE | EBITDA (in billions) | Gross Profit (in billions) | Revenue Growth |
|---|---|---|---|---|---|---|---|
| Diamondback Energy Inc | 8.47 | 1.88 | 3.55 | 3.55% | $1.23 | $1.05 | -31.1% |
| ConocoPhillips | 11.70 | 3.07 | 2.26 | 4.67% | $5.62 | $3.84 | -41.63% |
| EOG Resources Inc | 8.67 | 2.85 | 3 | 6.01% | $2.89 | $4.09 | -36.84% |
| Pioneer Natural Resources Co | 10.45 | 2.61 | 2.97 | 5.02% | $2.14 | $1.55 | -34.9% |
| Hess Corp | 31.04 | 5.26 | 4.36 | 5.96% | $1.43 | $1.77 | 22.32% |
| Devon Energy Corp | 6.46 | 2.75 | 1.80 | 6.25% | $1.63 | $1.05 | -38.61% |
| Coterra Energy Inc | 7.07 | 1.67 | 2.81 | 1.64% | $0.68 | $0.8 | -53.93% |
| EQT Corp | 6.08 | 1.28 | 3.01 | 0.62% | $0.47 | $-0.06 | -72.73% |
| Marathon Oil Corp | 8.67 | 1.51 | 2.69 | 2.54% | $0.99 | $0.55 | -31.55% |
| Ovintiv Inc | 3.75 | 1.44 | 1.05 | 3.9% | $0.94 | $1.33 | -32.63% |
| APA Corp | 8.13 | 17.20 | 1.37 | 66.09% | $1.15 | $0.86 | -41.06% |
| Chesapeake Energy Corp | 2.40 | 1.13 | 1.27 | 3.78% | $0.92 | $0.1 | -59.45% |
| Antero Resources Corp | 11.07 | 1.33 | 1.91 | 0.26% | $0.26 | $0.15 | -56.22% |
| Range Resources Corp | 6.78 | 2.61 | 2.93 | 1.43% | $0.18 | $0.14 | -63.57% |
| Southwestern Energy Co | 1.48 | 1.25 | 0.72 | 3.63% | $0.59 | $0.46 | -69.33% |
| Matador Resources Co | 8.99 | 2.06 | 2.84 | 7.47% | $0.52 | $0.37 | -8.16% |
| Civitas Resources Inc | 6.32 | 1.43 | 2.06 | 2.74% | $0.42 | $0.25 | -42.63% |
| Chord Energy Corp | 3.42 | 1.50 | 1.88 | 4.51% | $0.43 | $0.3 | 15.54% |
| Murphy Oil Corp | 7.13 | 1.38 | 1.91 | 1.9% | $0.37 | $0.33 | -32.05% |
| Permian Resources Corp | 10.14 | 1.58 | 1.96 | 2.29% | $0.42 | $0.3 | 31.89% |
| SM Energy Co | 4.65 | 1.48 | 1.93 | 4.59% | $0.37 | $0.24 | -44.81% |
| Magnolia Oil & Gas Corp | 8.51 | 2.60 | 3.49 | 5.59% | $0.21 | $0.2 | -42.17% |
| Northern Oil & Gas Inc | 2.66 | 2.76 | 1.93 | 13.62% | $0.35 | $0.19 | -23.81% |
| Average | 7.98 | 2.76 | 2.28 | 7.02% | $1.04 | $0.86 | -34.38% |
Through a meticulous analysis of Diamondback Energy, we can observe the following trends:
-
The Price to Earnings ratio of 8.47 for this company is 1.06x above the industry average, indicating a premium valuation associated with the stock.
-
Considering a Price to Book ratio of 1.88, which is well below the industry average by 0.68x, the stock may be undervalued based on its book value compared to its peers.
-
With a relatively high Price to Sales ratio of 3.55, which is 1.56x the industry average, the stock might be considered overvalued based on sales performance.
-
The Return on Equity (ROE) of 3.55% is 3.47% below the industry average, suggesting potential inefficiency in utilizing equity to generate profits.
-
With higher Earnings Before Interest, Taxes, Depreciation, and Amortization (EBITDA) of $1.23 Billion, which is 1.18x above the industry average, the company demonstrates stronger profitability and robust cash flow generation.
-
With higher gross profit of $1.05 Billion, which indicates 1.22x above the industry average, the company demonstrates stronger profitability and higher earnings from its core operations.
-
The company's revenue growth of -31.1% is notably higher compared to the industry average of -34.38%, showcasing exceptional sales performance and strong demand for its products or services.
Debt To Equity Ratio

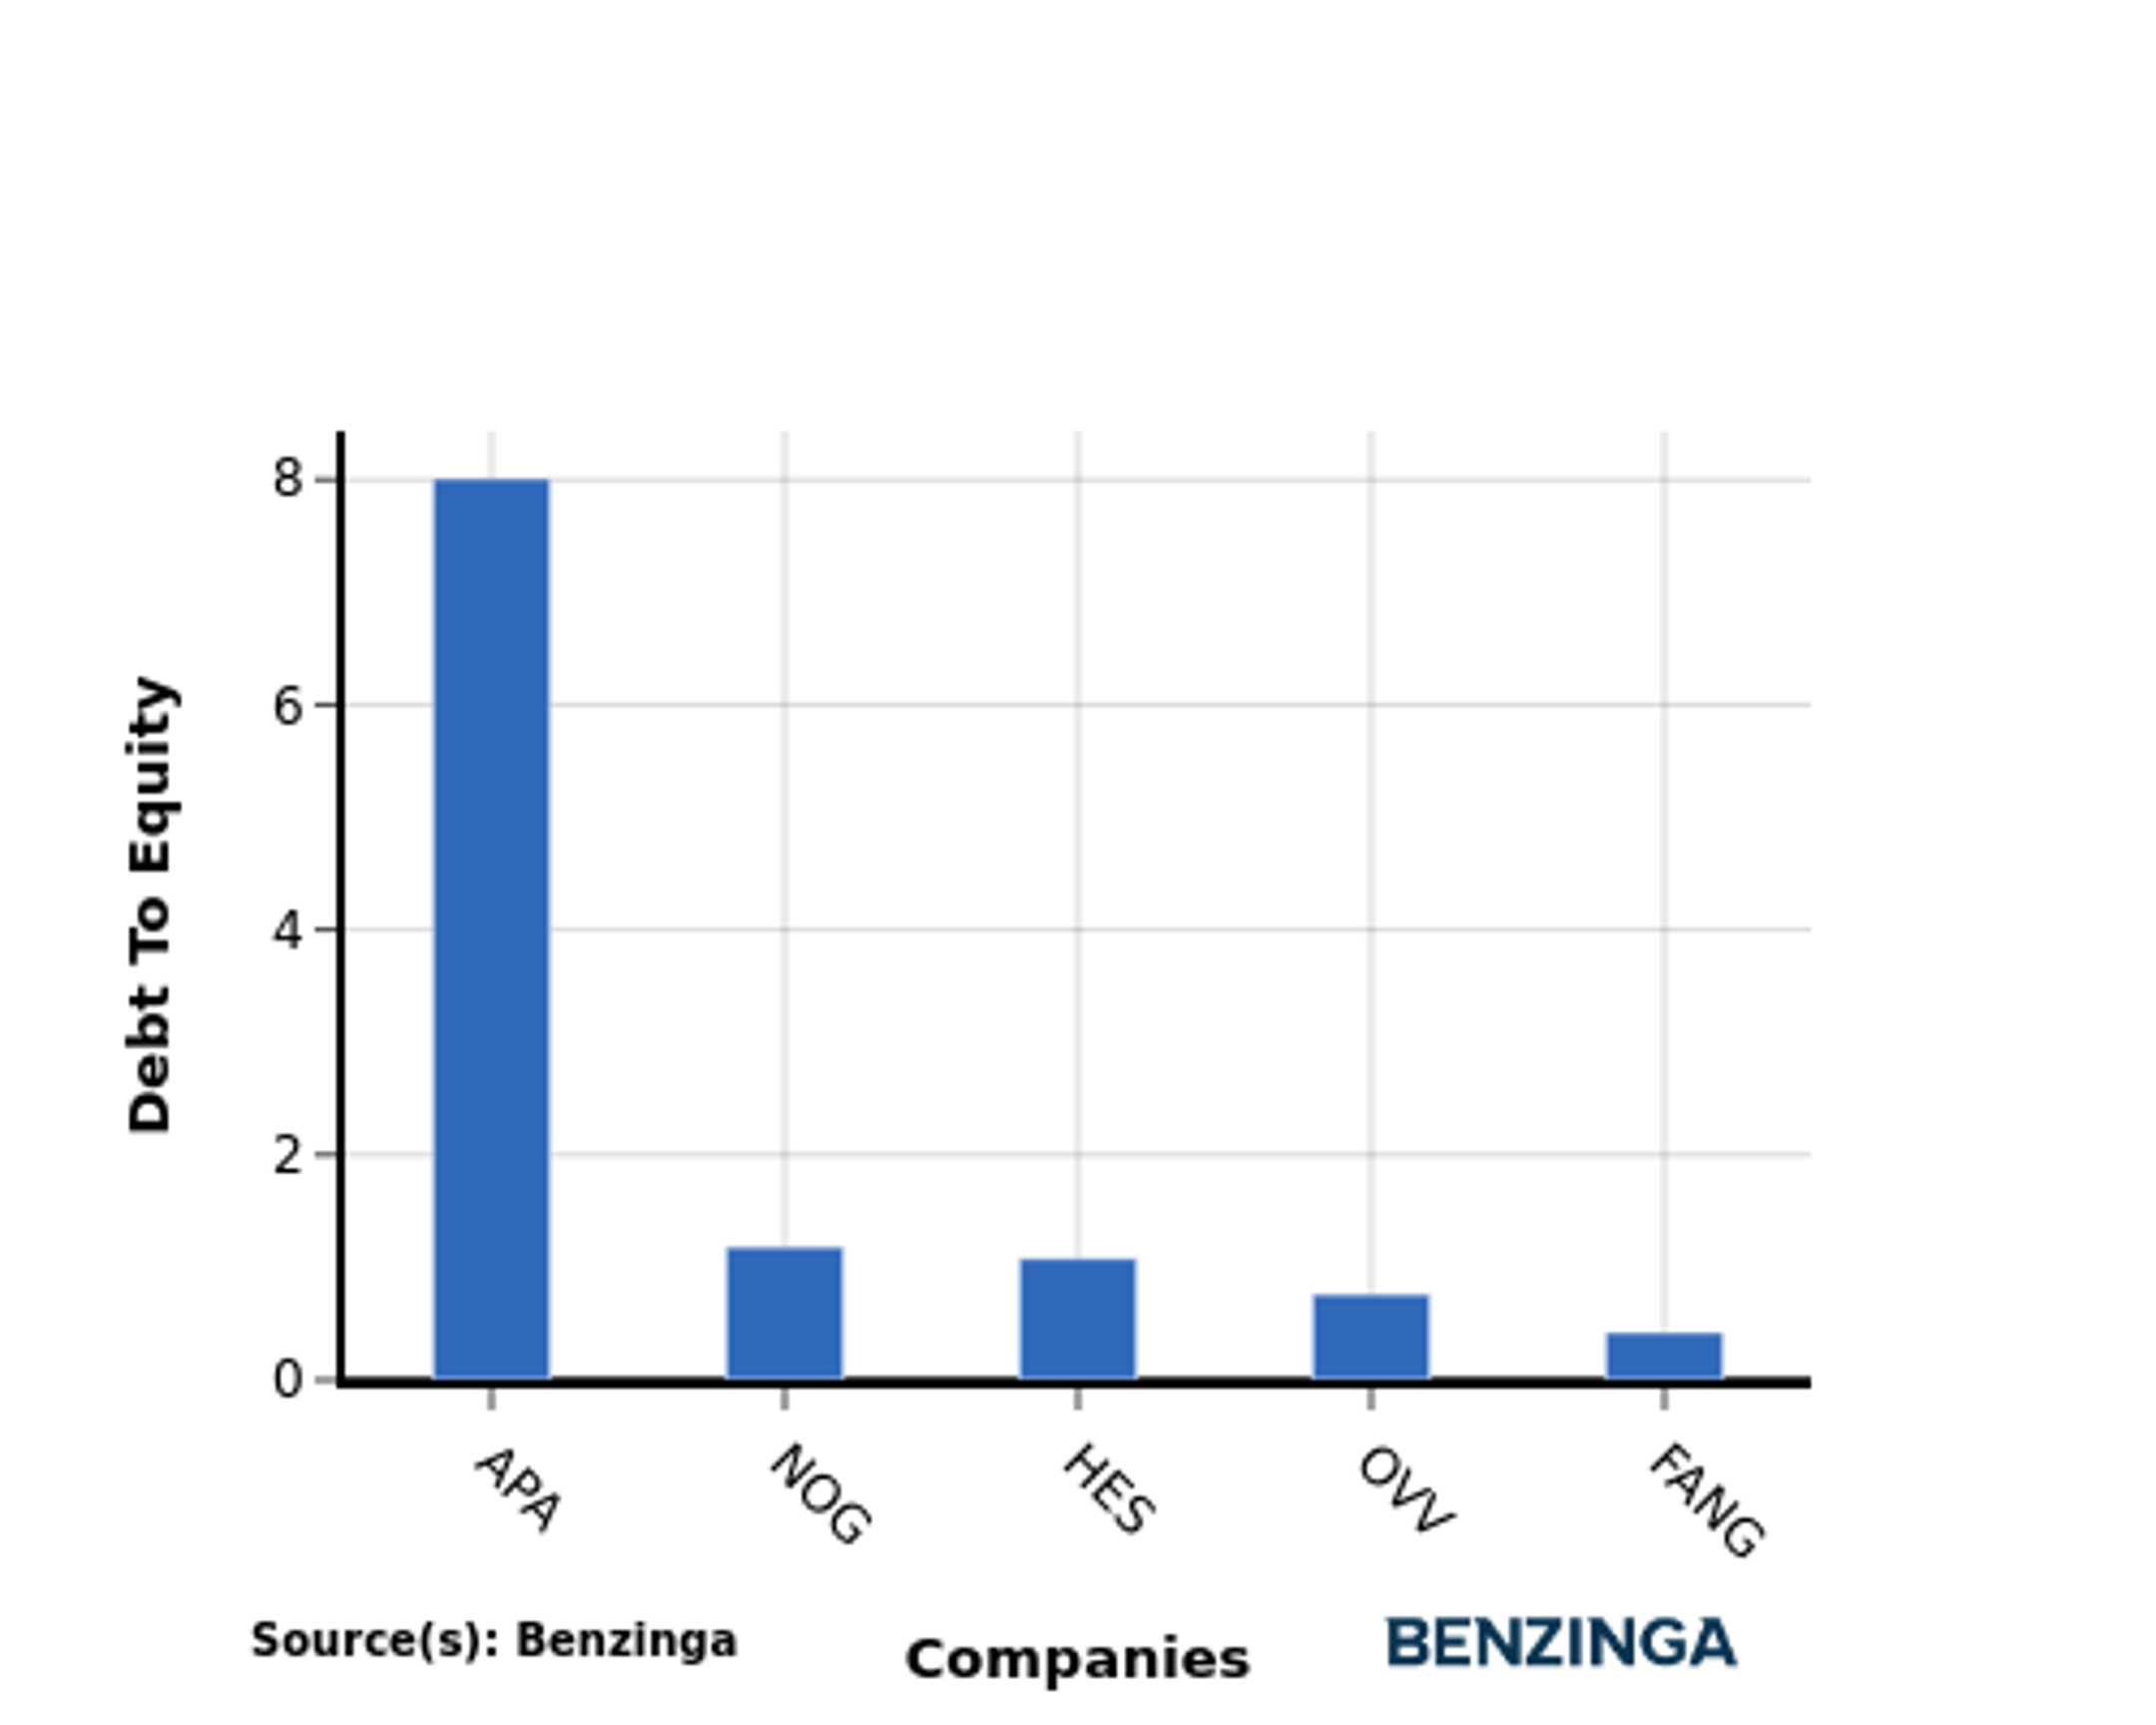
The debt-to-equity (D/E) ratio assesses the extent to which a company relies on borrowed funds compared to its equity.
Considering the debt-to-equity ratio in industry comparisons allows for a concise evaluation of a company's financial health and risk profile, aiding in informed decision-making.
When evaluating Diamondback Energy alongside its top 4 peers in terms of the Debt-to-Equity ratio, the following insights arise:
-
Diamondback Energy demonstrates a stronger financial position compared to its top 4 peers in the sector.
-
With a lower debt-to-equity ratio of 0.42, the company relies less on debt financing and maintains a healthier balance between debt and equity, which can be viewed positively by investors.
Key Takeaways
The valuation analysis for Diamondback Energy in the Oil, Gas & Consumable Fuels industry indicates a high PE ratio, suggesting that the company's stock may be overvalued compared to its peers. The low PB ratio suggests that the company's stock may be undervalued based on its book value. The high PS ratio indicates that the company's stock may be overvalued relative to its revenue. The low ROE suggests that the company's profitability is lower compared to its peers. The high EBITDA, gross profit, and revenue growth indicate strong financial performance compared to its industry peers.
This article was generated by Benzinga's automated content engine and reviewed by an editor.
© 2024 Benzinga.com. Benzinga does not provide investment advice. All rights reserved.
Trade confidently with insights and alerts from analyst ratings, free reports and breaking news that affects the stocks you care about.

