


In today's rapidly changing and fiercely competitive business landscape, it is essential for investors and industry enthusiasts to thoroughly analyze companies. In this article, we will conduct a comprehensive industry comparison, evaluating Broadcom AVGO against its key competitors in the Semiconductors & Semiconductor Equipment industry. By examining key financial metrics, market position, and growth prospects, we aim to provide valuable insights for investors and shed light on company's performance within the industry.
Broadcom Background
Broadcom is the sixth-largest semiconductor company globally and has expanded into various software businesses, with over $30 billion in annual revenue. It sells 17 core semiconductor product lines across wireless, networking, broadband, storage, and industrial markets. It is primarily a fabless designer but holds some manufacturing in-house, like for its best-of-breed FBAR filters that sell into the iPhone. It counts Apple as a large customer at roughly one fifth of sales. In software, it sells infrastructure and security software to large financial institutions and governments.Broadcom is the product of consolidation. Its businesses are an amalgamation of former companies like legacy Broadcom and Avago Technologies in chips, as well as Brocade, CA Technologies, and Symantec in software.
| Company | P/E | P/B | P/S | ROE | EBITDA (in billions) | Gross Profit (in billions) | Revenue Growth |
|---|---|---|---|---|---|---|---|
| Broadcom Inc | 25.80 | 15.67 | 9.89 | 14.98% | $4.91 | $6.16 | 4.87% |
| NVIDIA Corp | 97.83 | 36.38 | 30.88 | 23.79% | $7.41 | $9.46 | 101.48% |
| Taiwan Semiconductor Manufacturing Co Ltd | 15.35 | 4.53 | 6.49 | 5.8% | $341.62 | $260.2 | -9.98% |
| Texas Instruments Inc | 18.54 | 7.82 | 7.24 | 10.44% | $2.34 | $2.81 | -13.53% |
| Qualcomm Inc | 13.93 | 5.75 | 3.11 | 8.93% | $2.41 | $4.66 | -22.72% |
| Analog Devices Inc | 21.85 | 2.23 | 6.38 | 2.44% | $1.53 | $1.96 | -1.07% |
| ARM Holdings PLC | 124.60 | 11.93 | 18.91 | 2.54% | $0.15 | $0.64 | -2.46% |
| Microchip Technology Inc | 16.69 | 5.76 | 4.57 | 9.99% | $1.12 | $1.56 | 16.55% |
| ON Semiconductor Corp | 19.11 | 5.16 | 4.48 | 8.59% | $0.85 | $0.99 | 0.45% |
| STMicroelectronics NV | 8.53 | 2.32 | 2.15 | 7.28% | $1.64 | $2.11 | 2.55% |
| GLOBALFOUNDRIES Inc | 19.25 | 2.73 | 3.67 | 2.31% | $0.63 | $0.53 | -7.43% |
| United Microelectronics Corp | 8.23 | 1.64 | 2.42 | 4.72% | $29.0 | $20.46 | -24.3% |
| ASE Technology Holding Co Ltd | 14.23 | 1.77 | 0.87 | 3.06% | $28.07 | $24.92 | -18.27% |
| First Solar Inc | 98.19 | 2.54 | 5.12 | 2.86% | $0.26 | $0.31 | 30.55% |
| Skyworks Solutions Inc | 13.60 | 2.39 | 2.85 | 3.37% | $0.39 | $0.46 | -13.09% |
| Lattice Semiconductor Corp | 48.09 | 16.84 | 13.63 | 9.29% | $0.06 | $0.13 | 17.79% |
| Universal Display Corp | 33.12 | 5.10 | 11.29 | 3.75% | $0.07 | $0.11 | 7.33% |
| Rambus Inc | 30.39 | 5.96 | 12.15 | 19.78% | $0.03 | $0.1 | -1.07% |
| Allegro Microsystems Inc | 22.49 | 5.18 | 5.19 | 6.11% | $0.08 | $0.16 | 27.8% |
| MACOM Technology Solutions Holdings Inc | 16.76 | 5.59 | 7.61 | 1.31% | $0.03 | $0.09 | -13.78% |
| Average | 33.73 | 6.93 | 7.84 | 7.18% | $21.98 | $17.46 | 4.04% |
Through a thorough examination of Broadcom, we can discern the following trends:
-
The Price to Earnings ratio of 25.8 is 0.76x lower than the industry average, indicating potential undervaluation for the stock.
-
The elevated Price to Book ratio of 15.67 relative to the industry average by 2.26x suggests company might be overvalued based on its book value.
-
The stock's relatively high Price to Sales ratio of 9.89, surpassing the industry average by 1.26x, may indicate an aspect of overvaluation in terms of sales performance.
-
With a Return on Equity (ROE) of 14.98% that is 7.8% above the industry average, it appears that the company exhibits efficient use of equity to generate profits.
-
The Earnings Before Interest, Taxes, Depreciation, and Amortization (EBITDA) of $4.91 Billion is 0.22x below the industry average, suggesting potential lower profitability or financial challenges.
-
With lower gross profit of $6.16 Billion, which indicates 0.35x below the industry average, the company may experience lower revenue after accounting for production costs.
-
The company's revenue growth of 4.87% is notably higher compared to the industry average of 4.04%, showcasing exceptional sales performance and strong demand for its products or services.
Debt To Equity Ratio

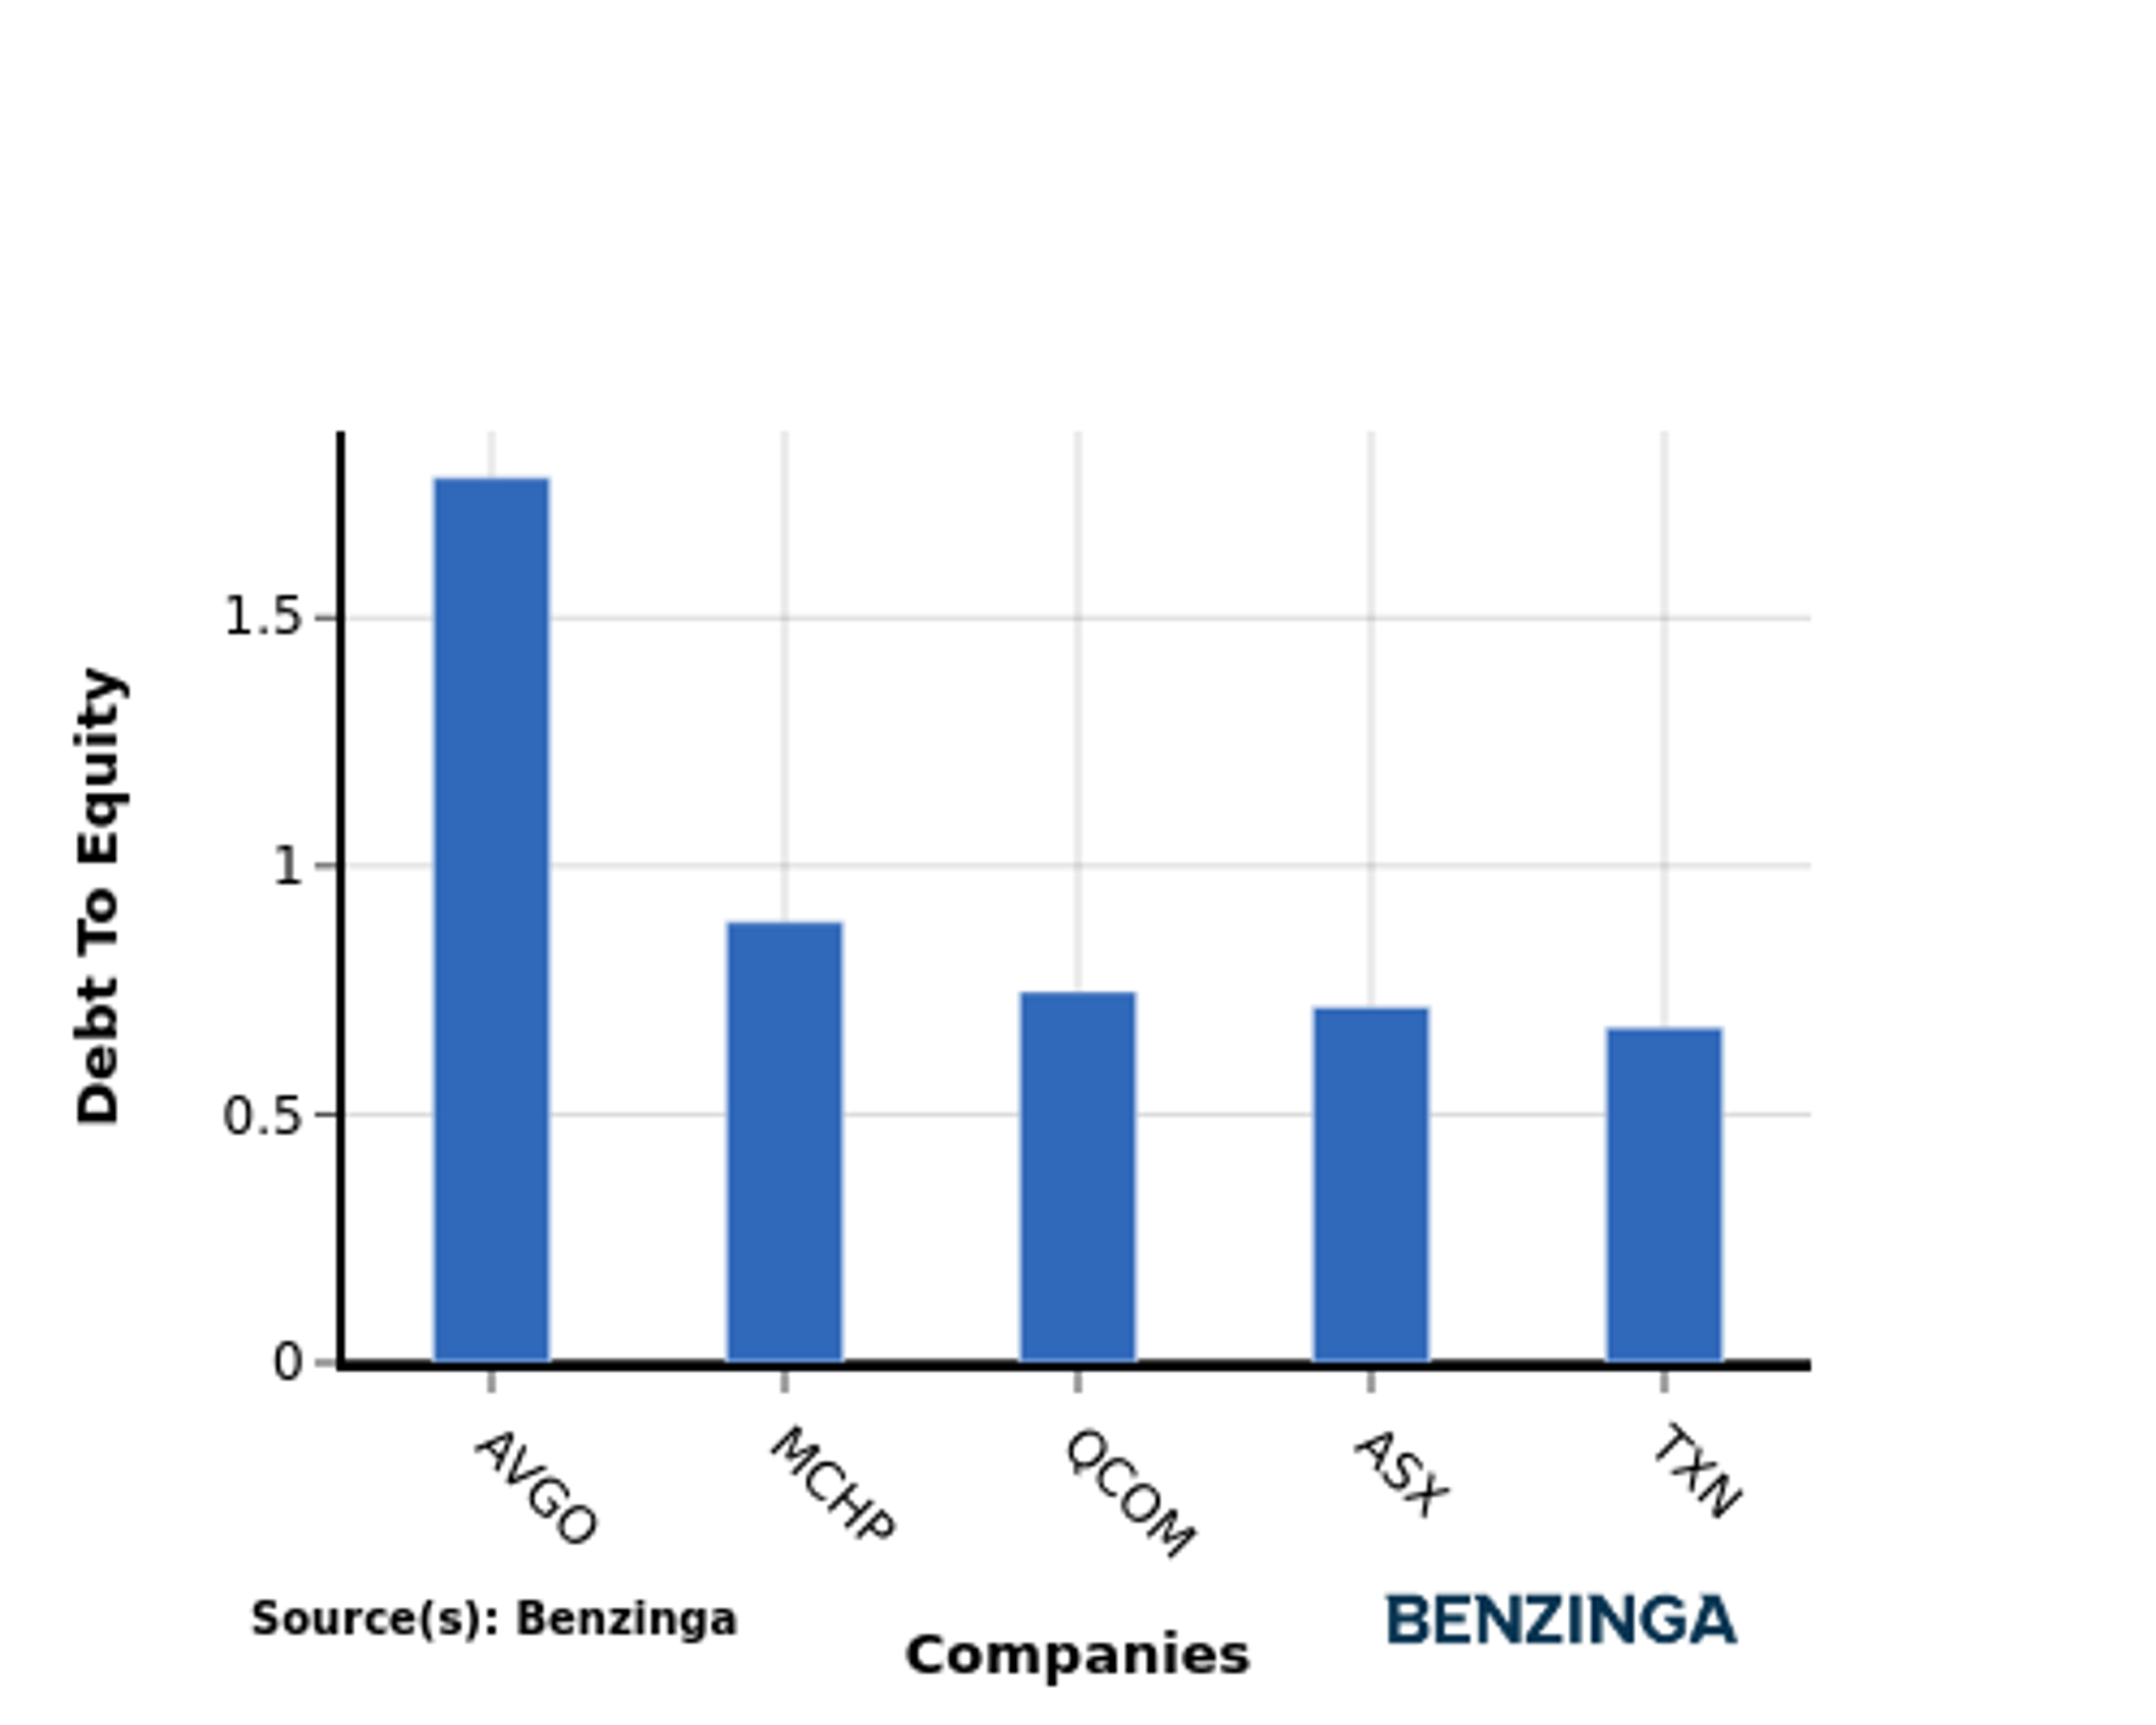
The debt-to-equity (D/E) ratio is a financial metric that helps determine the level of financial risk associated with a company's capital structure.
Considering the debt-to-equity ratio in industry comparisons allows for a concise evaluation of a company's financial health and risk profile, aiding in informed decision-making.
In terms of the Debt-to-Equity ratio, Broadcom can be assessed by comparing it to its top 4 peers, resulting in the following observations:
-
Among its top 4 peers, Broadcom has a higher debt-to-equity ratio of 1.78.
-
This implies a greater reliance on debt financing, which can expose the company to higher financial risk and potential challenges.
Key Takeaways
Broadcom's low PE ratio suggests that it may be undervalued compared to its peers in the Semiconductors & Semiconductor Equipment industry. However, its high PB and PS ratios indicate that the market may be overvaluing the company's assets and sales. On the other hand, Broadcom's high ROE suggests that it is generating strong returns on shareholder equity. Its low EBITDA and gross profit ratios indicate lower profitability compared to its peers. Lastly, Broadcom's high revenue growth suggests that the company is experiencing strong sales growth compared to its industry peers.
This article was generated by Benzinga's automated content engine and reviewed by an editor.
© 2024 Benzinga.com. Benzinga does not provide investment advice. All rights reserved.
Trade confidently with insights and alerts from analyst ratings, free reports and breaking news that affects the stocks you care about.

