


In today's rapidly changing and highly competitive business world, it is imperative for investors and industry observers to carefully assess companies before making investment choices. In this article, we will undertake a comprehensive industry comparison, evaluating Constellation Energy CEG vis-à-vis its key competitors in the Electric Utilities industry. Through a detailed analysis of important financial indicators, market standing, and growth potential, our goal is to provide valuable insights and highlight company's performance in the industry.
Constellation Energy Background
Constellation Energy Corp offers energy solutions. It provides clean energy and sustainable solutions to homes, businesses, the public sector, community aggregations, and a range of wholesale customers (such as municipalities, cooperatives, and other strategics). The company offers comprehensive energy solutions and a variety of pricing options for electric, natural gas, and renewable energy products for companies of any size.
| Company | P/E | P/B | P/S | ROE | EBITDA (in billions) | Gross Profit (in billions) | Revenue Growth |
|---|---|---|---|---|---|---|---|
| Constellation Energy Corp | 45.52 | 3.08 | 1.34 | 7.58% | $2.04 | $1.08 | -0.35% |
| NextEra Energy Inc | 12.21 | 2.23 | 3.67 | 6.37% | $4.75 | $4.86 | 41.79% |
| Southern Co | 22.99 | 2.30 | 2.56 | 2.74% | $2.73 | $2.74 | -20.23% |
| Duke Energy Corp | 18.30 | 1.42 | 2.27 | -0.5% | $4.09 | $3.08 | 0.21% |
| PG&E Corp | 16.86 | 1.61 | 1.47 | 1.58% | $1.71 | $1.91 | 3.36% |
| Exelon Corp | 17.48 | 1.48 | 1.87 | 1.37% | $1.71 | $1.89 | 13.66% |
| American Electric Power Co Inc | 18.58 | 1.54 | 1.89 | 2.19% | $1.73 | $2.61 | -5.76% |
| Xcel Energy Inc | 17.93 | 1.84 | 2.04 | 1.71% | $1.05 | $1.18 | -11.74% |
| Cia Paranaense De Energia Copel | 59.54 | 5.61 | 5.09 | 1.47% | $0.89 | $0.68 | 1.92% |
| Edison International | 24.47 | 1.68 | 1.36 | 2.58% | $1.55 | $1.58 | -1.1% |
| Entergy Corp | 14.01 | 1.47 | 1.44 | 2.98% | $1.34 | $1.36 | -16.17% |
| FirstEnergy Corp | 42.23 | 1.84 | 1.50 | 2.26% | $0.95 | $1.97 | 6.67% |
| Eversource Energy | 16.38 | 1.24 | 1.52 | 0.1% | $0.36 | $1.04 | 2.2% |
| PPL Corp | 23.67 | 1.21 | 1.96 | 0.8% | $0.65 | $0.71 | 7.49% |
| Centrais Eletricas Brasileiras SA | 35.64 | 0.72 | 2.26 | 1.89% | $4.28 | $4.83 | 4.47% |
| Alliant Energy Corp | 18.24 | 1.86 | 2.86 | 2.5% | $0.42 | $0.41 | -3.29% |
| Avangrid Inc | 19.17 | 0.57 | 1.38 | 0.44% | $0.44 | $0.57 | -11.54% |
| Evergy Inc | 14.69 | 1.16 | 1.91 | 1.88% | $0.61 | $0.71 | -6.38% |
| Pinnacle West Capital Corp | 20.21 | 1.37 | 1.80 | 1.78% | $0.42 | $0.44 | 5.65% |
| OGE Energy Corp | 14.90 | 1.49 | 2.09 | 2.02% | $0.29 | $0.29 | -24.72% |
| Cia Energetica DE Minas Gerais - Cemig | 5.02 | 1.11 | 0.73 | 5.37% | $2.18 | $2.02 | 7.38% |
| Idacorp Inc | 17.51 | 1.67 | 2.68 | 2.42% | $0.15 | $0.08 | 15.36% |
| Portland General Electric Co | 16.61 | 1.26 | 1.31 | 1.24% | $0.2 | $0.43 | 9.64% |
| Average | 21.21 | 1.67 | 2.08 | 2.05% | $1.48 | $1.61 | 0.86% |
By analyzing Constellation Energy, we can infer the following trends:
-
Notably, the current Price to Earnings ratio for this stock, 45.52, is 2.15x above the industry norm, reflecting a higher valuation relative to the industry.
-
With a Price to Book ratio of 3.08, which is 1.84x the industry average, Constellation Energy might be considered overvalued in terms of its book value, as it is trading at a higher multiple compared to its industry peers.
-
The Price to Sales ratio is 1.34, which is 0.64x the industry average. This suggests a possible undervaluation based on sales performance.
-
The company has a higher Return on Equity (ROE) of 7.58%, which is 5.53% above the industry average. This suggests efficient use of equity to generate profits and demonstrates profitability and growth potential.
-
The company exhibits higher Earnings Before Interest, Taxes, Depreciation, and Amortization (EBITDA) of $2.04 Billion, which is 1.38x above the industry average, implying stronger profitability and robust cash flow generation.
-
Compared to its industry, the company has lower gross profit of $1.08 Billion, which indicates 0.67x below the industry average, potentially indicating lower revenue after accounting for production costs.
-
With a revenue growth of -0.35%, which is much lower than the industry average of 0.86%, the company is experiencing a notable slowdown in sales expansion.
Debt To Equity Ratio

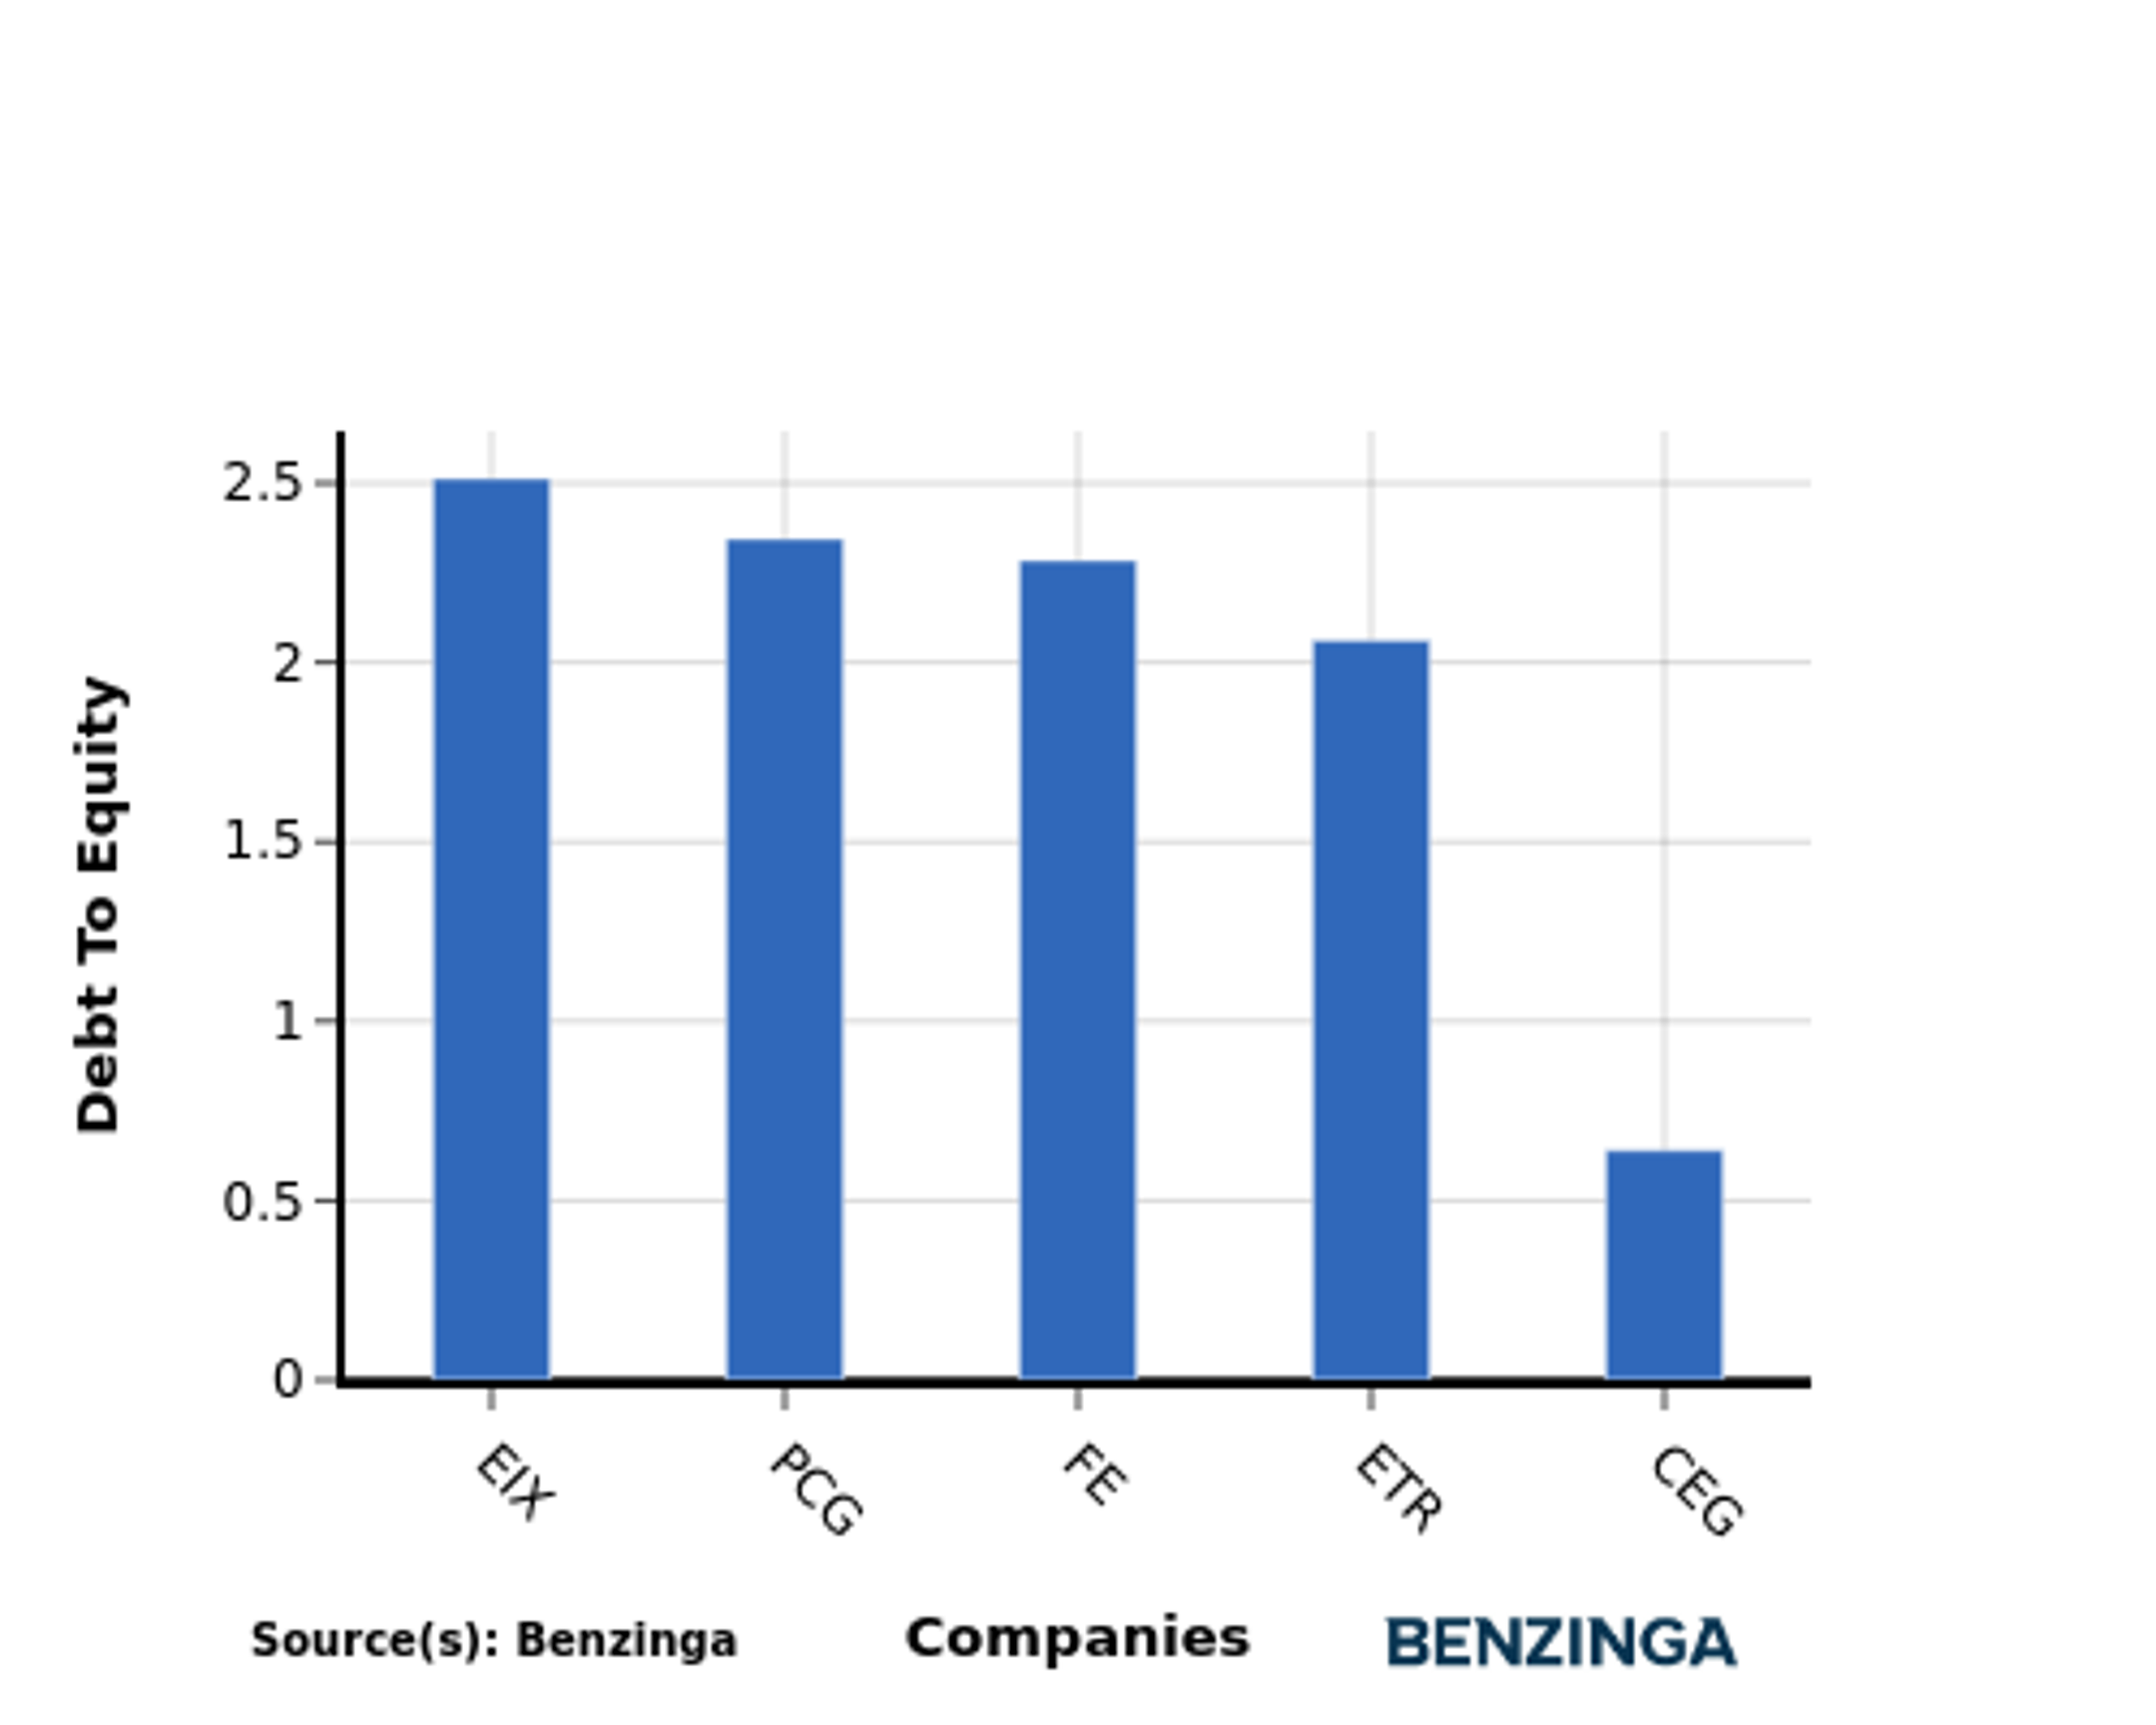
The debt-to-equity (D/E) ratio is a financial metric that helps determine the level of financial risk associated with a company's capital structure.
Considering the debt-to-equity ratio in industry comparisons allows for a concise evaluation of a company's financial health and risk profile, aiding in informed decision-making.
In terms of the Debt-to-Equity ratio, Constellation Energy stands in comparison with its top 4 peers, leading to the following comparisons:
-
Constellation Energy has a stronger financial position compared to its top 4 peers, as evidenced by its lower debt-to-equity ratio of 0.64.
-
This suggests that the company has a more favorable balance between debt and equity, which can be perceived as a positive indicator by investors.
Key Takeaways
Constellation Energy has a high PE ratio, indicating that its stock price is relatively high compared to its earnings. The high PB ratio suggests that the stock is trading at a premium to its book value. The low PS ratio implies that the company's stock price is relatively low compared to its revenue. The high ROE indicates that Constellation Energy is generating strong returns on its shareholders' equity. The high EBITDA suggests that the company has a healthy operating profit margin. The low gross profit indicates that Constellation Energy has lower profitability compared to its peers. The low revenue growth suggests that the company's sales are growing at a slower pace compared to its industry peers.
This article was generated by Benzinga's automated content engine and reviewed by an editor.
© 2024 Benzinga.com. Benzinga does not provide investment advice. All rights reserved.
Trade confidently with insights and alerts from analyst ratings, free reports and breaking news that affects the stocks you care about.

