
EUR/USD Current Price: 1.0928
- Fed Chief Powell announced additional easing, confident economy would rebound.
- The coronavirus crisis continues to develop, with no economic comeback at sight.
- EUR/USD at its highest in a week, but it’s all about the greenback.
The American dollar tumbled this Thursday, as investors rushed into high-yielding equities. The EUR/USD pair finally woke up and advanced to 1.0951, its highest in a week, after the US Federal Reserve announced it had taken additional easing measures through a plan to provide $2.3 trillion in loans to support the economy. Chief Powell spoke afterwards, and his comments were read as hawkish. Following Initial Jobless Claims soaring to 6606K in the week ended March 3, Powell said that the speed towards very high unemployment is “alarming,” although he added it will be temporary. He then added that the economic rebound after the ongoing coronavirus crisis “can be robust.”
Another negative factor for the greenback was the preliminary estimate of the April Michigan Consumer Sentiment Index, which plummeted to 71 from 89.1 in March. Meanwhile, the coronavirus pandemic is nowhere close to an end. Despite some modest improvements in specific numbers, the crisis continues, and there are no clear plans to lift lock-downs that keep one-third of the world’s population at home. Good Friday will keep most major markets closed in the last day of the week, although the US will publish March inflation figures.
EUR/USD Short-Term Technical Outlook
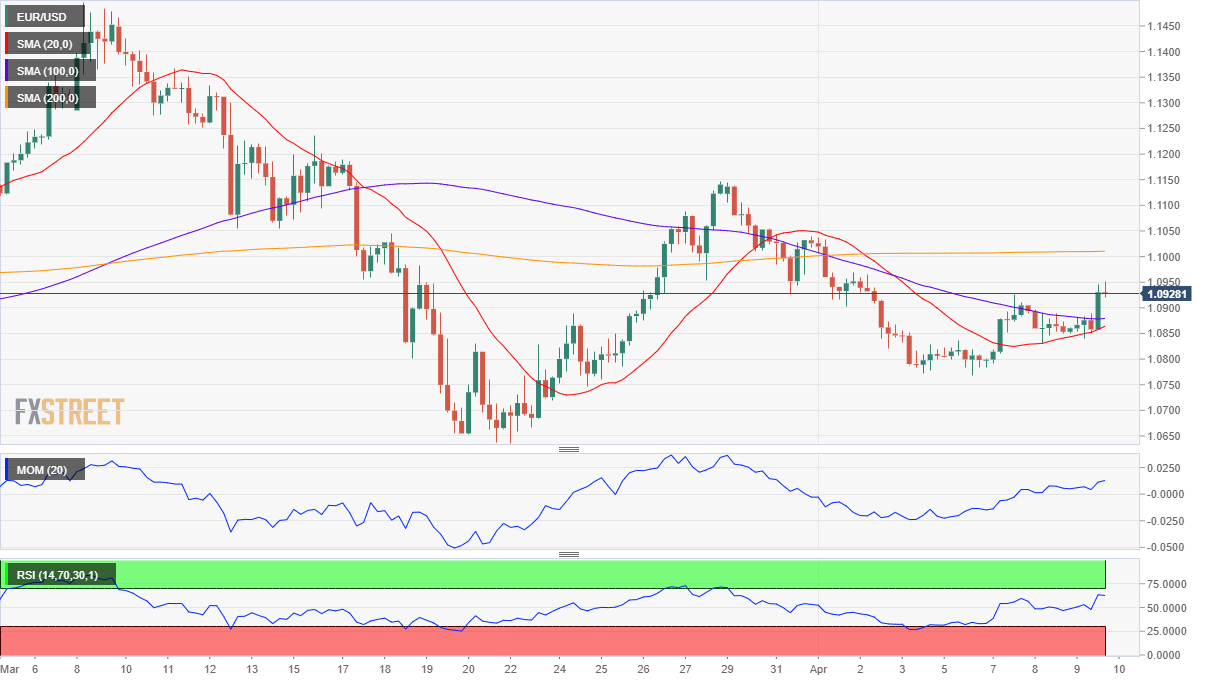
The EUR/USD pair neared the 38.2% retracement of its latest daily advance at 1.0950, the immediate resistance. The bullish potential seems limited, as the market has no real reasons to buy the shared currency, with gains always related to the dollar’s weakness. In the 4-hour chart, the pair offers a neutral-to-bullish stance, as the pair has advanced above its 20 and 100 SMA, which anyway lack directional strength. The 200 SMA is also flat, although above the current level. The Momentum indicator in the mentioned time-frame remains horizontal just above its 100 level, while the RSI eases, but holds around 60.
Support levels: 1.0900 1.0865 1.0830
Resistance levels: 1.0950 1.0990 1.1025
Image sourced from Pixabay
© 2024 Benzinga.com. Benzinga does not provide investment advice. All rights reserved.
Comments
Trade confidently with insights and alerts from analyst ratings, free reports and breaking news that affects the stocks you care about.

