


If you blinked (or slept), you probably missed last night’s government shutdown, which ended soon after it began. This crazy week is also about to end, and it probably can’t come soon enough for investors tired of watching the market get tossed around like a bottle in the ocean.
Pre-market trading pointed to a possible stronger open after Thursday’s 1,000-point plunge in the Dow Jones Industrial Average ($DJI). Every sector fell yesterday, but industrials, info tech, financials, and consumer discretionary got hit hardest. Any sign of improvement in those sectors today might be worth tracking to see if confidence is making its way back. Still, investors might want to be careful late in the session, because it’s in the last hour that things have gotten pretty weird lately.
While it’s impossible to predict which direction things might end up going today, volatility rose once again overnight. VIX jumped to nearly 34 early Friday, and that could signal more choppiness ahead. A rise in VIX often signals pressure on stocks, though there was some upward movement in overnight pre-market trading. On a potentially more positive note, 10-year Treasury yields fell mildly to about 2.82%, down from 2.85% yesterday. All week, it’s been nervousness over higher yields that apparently led to much of the selling. We’re still not far from the 2.885% high, however.
Congress passed a budget in the middle of the night and President Trump signed it this morning. Uncertainty is never good for stocks, so this could remove one layer. The not-so-good news, maybe, is that economists believe the new budget will raise deficits by $1.4 trillion over 10 years. That could mean more pressure on the interest rate complex as additional supply becomes available. The more debt flooding the market, the higher yields typically need to go to attract buyers.
If you’re looking for good news, check out Nvidia’s (NVDA) earnings. The chipmaker’s stock jumped nearly 9% in pre-market trading after the company easily beat Wall Street analysts’ forecasts. The company’s guidance for the next quarter also topped consensus views. Gaming revenue rose 29% year-over-year.
Crude oil crumbled to near the $60 a barrel level (see more below), while European and Asian stocks followed U.S. shares lower overnight. The carnage was a lot worse in Asia than in Europe, maybe a sign that fear eased a bit as the hours passed.
News today is a little sparse. A few earnings trickle in, but we’ll be about two-thirds done with the season by the end of this week. No Fed speakers are on the calendar, and no major data, either. It looks like stocks can just stew in their own juices today, with little influence from outside. That’s especially true now that the alarm bells in Washington, D.C., have momentarily ceased.
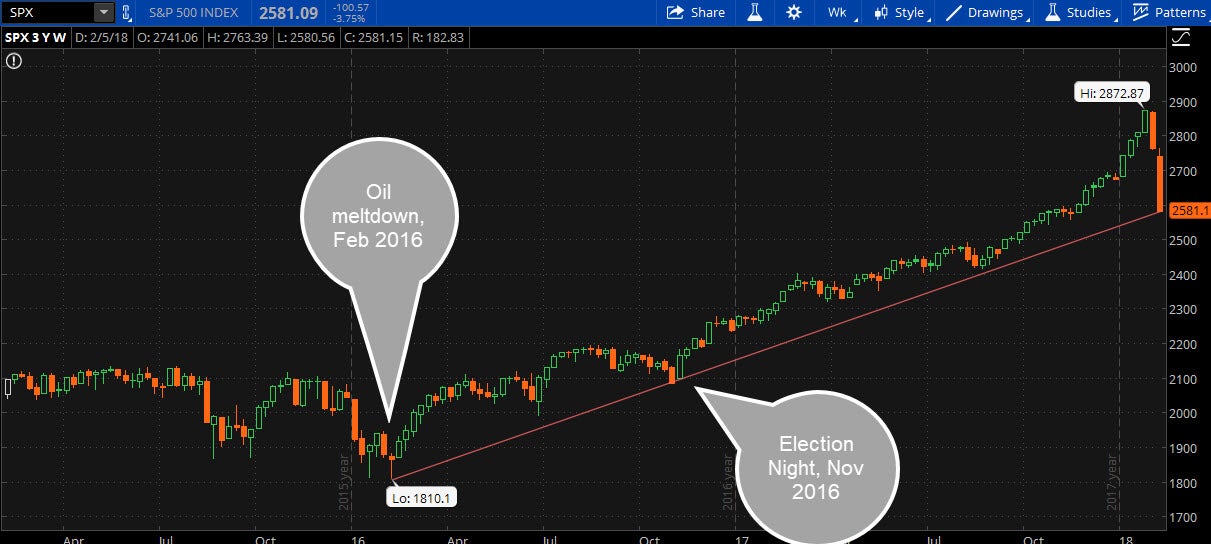
From a technical standpoint, it might be worth keeping an eye on the 2,581 level for the S&P 500 Index (SPX). A simple trend line (see figure 1 below) shows a line that includes bounces off of a couple of the biggest stories of 2016 — the bottoming out of the crude oil market on Feb 8, 2016, and the U.S. presidential election in November of that year. Might this level hold? It's certainly an area worth watching.
There’s no one explanation for this bout of stock market weakness, though it’s disheartening for many after Tuesday’s quick rebound. You could conceivably look at lots of factors and never settle on one benchmark. We’ve covered a lot of them here. They possibly include investors unwinding the short-volatility/long stocks trade that had been popular for months, wages rising 2.9% and raising inflation concerns, proposed deficit spending by Congress, and the recent quick jump in Treasury yields to above last year’s highs. Don’t discount the “pent up” selling demand that may have developed in 2017 when many investors may not have wanted to sell into a big rally.
There’s also an emotional content. Arguably, many people had been lulled by the low volatility of the last year and a half. Stocks went months without a 1% daily decline or advance, and just steadily moved upward. Once things went south, there may have been a sharper reaction than normal, like the shock of being woken up from a deep sleep. Now, with volatility so high, potential buyers might not feel comfortable getting in, even though company news continues to look pretty solid.
While no one knows which way the market will ultimately go today, investors should consider exercising extreme care before dipping their toes in the water, especially on short-term trades. The shorter your time frame, the more exposure you’ll have to this volatility. It looks like the big ups and downs could last for a few weeks, so investors might want to step back and get a sense of the bigger picture before making any commitments.
FIGURE 1: TREND LINES. The market close in the S&P 500 Index (SPX) Thursday breached a trendline that includes the February 2016 oil low and the 2016 presidential election, two of the big market events in 2016. Data source: Standard & Poor’s. Chart source: The thinkorswim® platform from TD Ameritrade. For illustrative purposes only. Past performance does not guarantee future results.
50’s Nostalgia?
It seems that oil prices are more in sync with stocks after many months in which the two went their different ways. At this point, crude has fallen about $6 from its 2018 highs, and threatens to backtrack into the $50s per barrel. Oil lost ground as the stock market cratered on Monday, and didn’t show much recovery even as stocks rebounded and then came down again over the next few days. Analysts point out that there was a huge speculative long position in the oil market, and that seems to be unraveling as investors appear to be skittish about remaining in some of the more volatile market neighborhoods. Crude isn’t the only commodity people are diving out of. Copper futures are now down 7% for the year, though still up 12% over the last year. Both copper and oil tend to swing higher when there’s economic optimism and vice versa. A stronger dollar seems to also be hurting commodity prices. The dollar index remained slightly higher at just above 90 early Friday.
But Fundamentally…
Chances are, if you swooped in from outer space in your Tesla today and checked the market fundamentals on their own, you might be puzzled about why the stock market is under so much pressure. All through the week, even as the roller coaster ride continued on Wall Street, company earnings kept surpassing analysts’ estimates. Nvidia is the latest to impress. In addition, there’s no sign of a breakdown in credit markets or a looming recession, the way it’s sometimes been during past market meltdowns. What seems to really be unnerving investors is that interest rate number, but the fact is, rates remain historically low. If you look back at the 1990s market surge, it happened when borrowing costs were far higher. Though times have changed a lot since then, it would seem to imply that a rally can happen even when yields advance well above today’s levels.
Inflation Check-In Ahead
The next inflation check-up comes next week, when investors get a look at January producer and consumer price index data. Wednesday brings the consumer price index (CPI) as a Valentine’s Day gift to the market, while Thursday follows up with the producer price index (PPI). Since climbing Treasury yields are often seen as a sign of investors’ inflation fears, the numbers next week could possibly reinforce or ease those concerns. The December numbers for both CPI and PPI didn’t really show much in the way of price rises, though one month is never a trend. PPI actually fell 0.1% in December from a month earlier, while CPI rose 0.1%, with core CPI up a little more at 0.3%. By early next week, we’ll probably be seeing some analyst estimates for the January numbers, so stay tuned to see if anyone is anticipating an inflation uptick that might back up some of what we’re seeing in the interest rate complex.
Information from TDA is not intended to be investment advice or construed as a recommendation or endorsement of any particular investment or investment strategy, and is for illustrative purposes only. Be sure to understand all risks involved with each strategy, including commission costs, before attempting to place any trade.
© 2024 Benzinga.com. Benzinga does not provide investment advice. All rights reserved.
Trade confidently with insights and alerts from analyst ratings, free reports and breaking news that affects the stocks you care about.

