


Hourly Chart

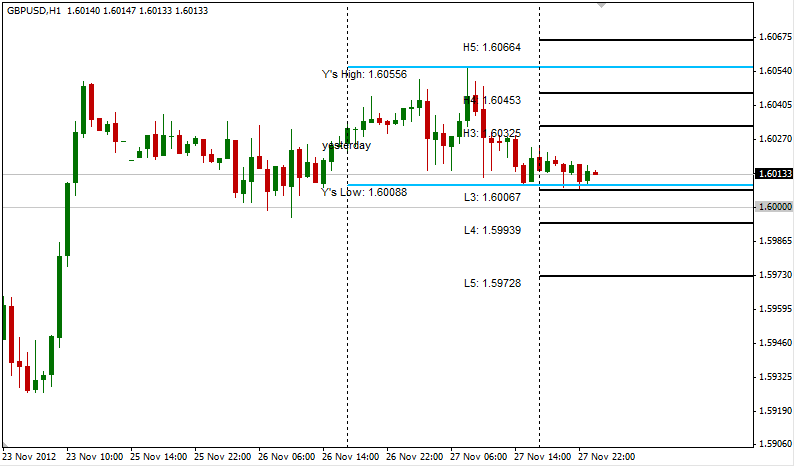
After the strong rally on 23rd Nov, Cable has been comfortably trading within 1.60 – 1.605 range. Currently price looks to test 1.60 once again with Yesterday's Low and L3 acting as support against such a move.
Daily Chart
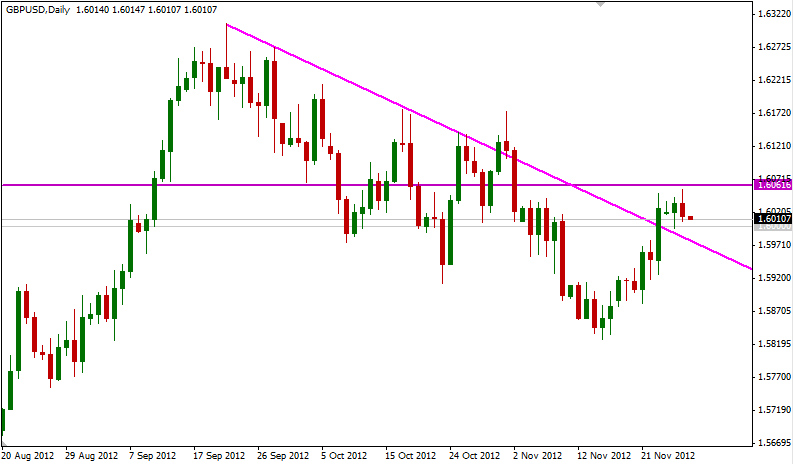
From the Daily Chart, we are looking at a downtrend since Mid Sep. Zooming out further, it appears that price has been moving in an oscillating fashion, despite etching out Higher Highs and Higher Lows since 1 year ago.
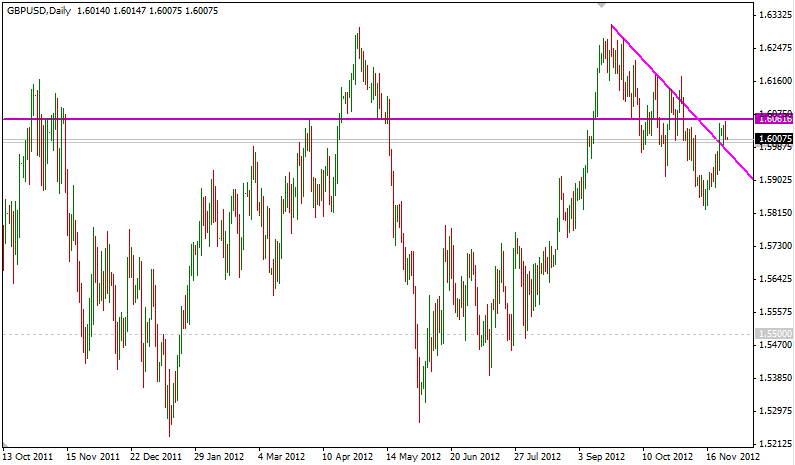
Also, UK's 10 year Gilts yields has widen against US 10 year Treasuries, showing that Market is pricing in a higher risk premium against UK, which is never good news for the Sterling. Should price enter back into the 1.54 – 1.60 consolidation (found between Feb – April 2012), we could potentially see an acceleration towards the 1.54 level, with 1.575 acting as interim support.
Of course, with US economy being highly unstable (see: fiscal cliff), we could yet see a bout of weakness in the Greenback which may propel Cable higher and other currencies once more.
This article is for general information purposes only. It is not investment advice or a solution to buy or sell securities. Opinions are the authors; not necessarily that of OANDA Corporation or any of its affiliates, subsidiaries, officers or directors. Leveraged trading is high risk and not suitable for all. You could lose all of your deposited funds.

© 2024 Benzinga.com. Benzinga does not provide investment advice. All rights reserved.
Trade confidently with insights and alerts from analyst ratings, free reports and breaking news that affects the stocks you care about.

