Reading between the lines, the central bankers are acknowledging the concerns of the consumer as it relates to costs of living. On a fundamental note, this circumstance may aid TJX stock due to the underlying discount retail business model.
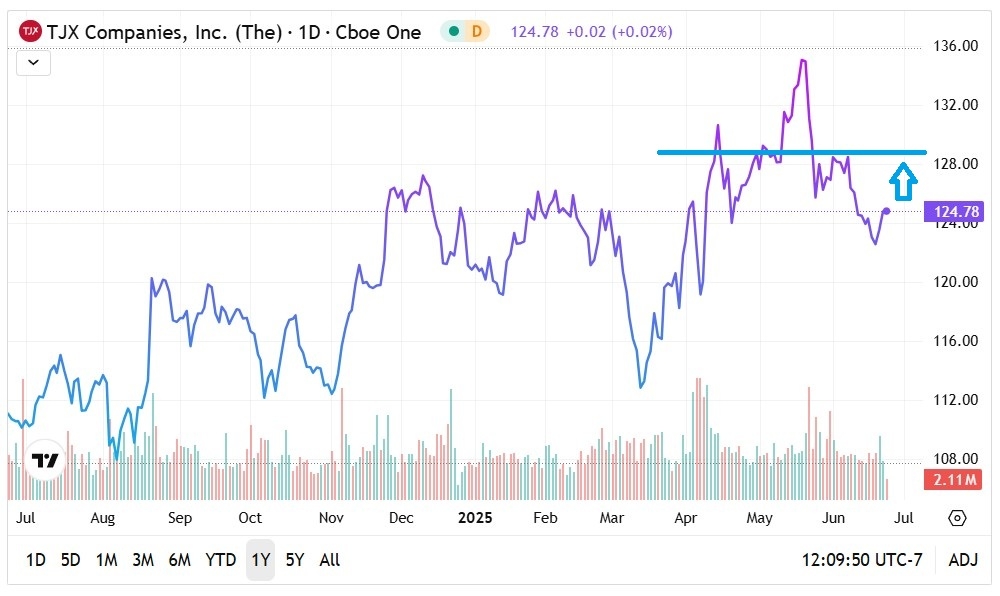
From a technical viewpoint, there appears to be a resistance level at around $128. The idea here is that TJX stock could potentially hit this level within a few weeks, thus triggering an option strategy's profitability zone.
Using Statistical Analysis To Pinpoint A Strategy For TJX Stock
While both the fundamental and technical frameworks for TJX stock are arguably bullish, these methodologies only speak to the potential magnitude component of the underlying thesis or the price chart's y-axis. But with options trading, the x-axis is also critical; otherwise, the right thesis at the wrong time may still result in a complete loss of principal in a debit-based strategy.
To better understand the lay of the land, traders must view the problem probabilistically, which requires statistical analysis. At first glance, this process sounds easy: just take the frequency of the desired outcome divided by the total number of events in the dataset. However, this approach only calculates what's known as the derivative probability or the odds of an outcome across the dataset's entire distribution.
Unfortunately, derivative probabilities aren't very useful. For instance, air travel is statistically considered a safe form of travel but this insight is aggregated across the experiences of all flyers. If your pilot is inebriated or air traffic control employees are under extreme stress, the odds of something bad happening dramatically increase.
In other words, the probabilities that we're looking for is conditional. This refers to the odds of an outcome based off a specific subset of the data. But in order to extract conditional probabilities, the dataset (price action in this case) must be organized in discrete states to distinguish one state from another. Therefore, my metric of choice is market breadth — sequences of accumulative and distributive sessions.
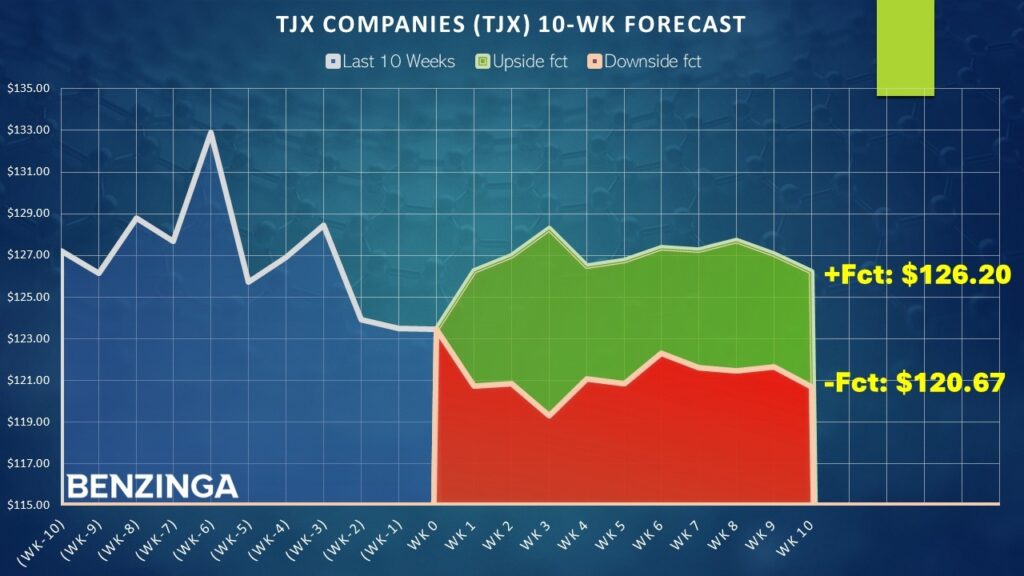
Discrete states represent the backbone of Markov chain analysis, which is the mathematical principle that I have been utilizing in the past few months. As it relates to TJX stock, the past two months' price action can be converted into discrete states under the sequencing format "4-6-U": four up weeks, six down weeks, with a net positive trajectory across the 10-week period.
Admittedly, this process compresses the magnitude dynamism of TJX stock into a simple binary code. However, the benefit from a statistical standpoint is that the last-10-week intervals can be identified as unique behavioral states. Using past analogs, we can determine that when the 4-6-U sequence flashes, there's a 63.64% chance that the following week's price action results in upside, with a median return of 2.28%.
Projecting an upside target isn't an exact science due to the market's usual chaos. However, if the bulls maintain control of the market, a rational target is $128.20 over the next three to four weeks — roughly aligning with the aforementioned resistance level.
A Bold Debit Call Spread For The Risk-Tolerant Speculator
For traders interested in rolling the mathematical dice, the 127/128 bull call spread expiring July 18 may be tempting. This transaction involves buying the $127 call and simultaneously selling the $128 call, for a net debit paid of $46 (the most that can be lost in the trade). Should TJX stock rise through the short strike price ($128) at expiration, the maximum reward is $54, a payout of over 117%.
What makes this trade so enticing is the implied shift in sentiment regime of the 4-6-U sequence. As a baseline, the chance that TJX stock may rise over any given week is 54.11%. Therefore, the aforementioned sequence boosts the bullish odds quite significantly. In other words, the call spread may be favorably mispriced.
Part of the reason for the mispricing is that the vast majority of Wall Street analysts rely on interpretations of non-stationary price signals or financial ratios. Generally, these interpretations are vague, presenting difficulties for traders. With the above discrete-state analysis, we're using math and science to help pinpoint our strategic framework.
Read Next:
Photo: Shutterstock
© 2026 Benzinga.com. Benzinga does not provide investment advice. All rights reserved.
To add Benzinga News as your preferred source on Google, click here.