Not Reading Slope Of Hope Can Be Expensive
Back on Tuesday, February 12th, hedge fund manager, market technician and proprietor of the Slope of Hope blog, Tim Knight noted natural resources stocks were weakening and suggested shorting Cliffs Natural Resources CLF.
The next day, Cliffs dived 20% after announcing a cut in its dividend after the close on Tuesday.
From A Mess To The Masses
The old Odd Lot Theory was based on a simple premise: the average, small investor (those who couldn't afford round lots of shares) was usually wrong. Guess which stock Fidelity customers were buying with both hands as it dropped 20% on February 13th?
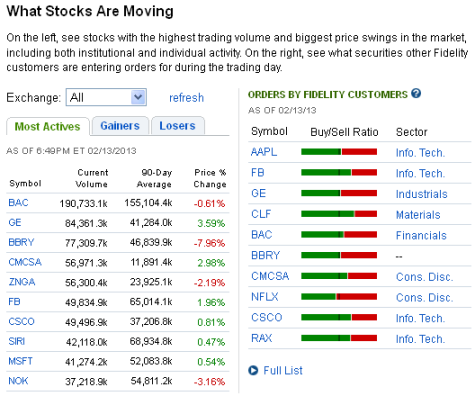
As the screen capture from Fidelity's website that day shows, CLF was one of the most actively traded names on Fidelity's system on February 13th -- 70% of those trades were buy orders.
Hedging CLF on February 13th
At the time I noted in a Benzinga post that, of course the best time to consider hedging a stock was before it suffered a large drop, but given the number of falling knife buyers that day -- and the possibility that CLF could keep falling -- I'd post a couple of optimal hedges. As Tim Knight pointed out in a follow up post on Monday ("Cliff - The Short That Keeps Delivering"), CLF did indeed keep falling. Below are the CLF hedges I posted on February 13th, along with how those hedges have reacted as the stock has continued to tumble.
Two Ways To Hedge CLF
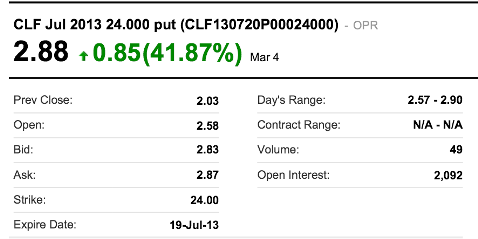
The first way used optimal puts*; that way had a cost, but allowed uncapped upside. These were the optimal puts, as of February 13th's close, for an investor who was looking to hedge 1000 shares of CLF against a greater-than-20% drop between then and July 19th:
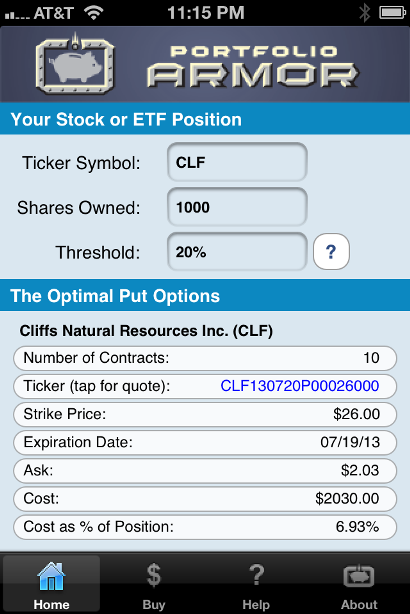
As you can see in the screen capture above, the cost of those optimal puts, as a percentage of position, was 6.93%. Note that, to be conservative, cost here was calculated using the ask price of the optimal puts; in practice an investor can often buy puts for a lower price (i.e., some price between the bid and the ask). By way of comparison, the cost of hedging the SPDR S&P 500 ETF SPY against the same decline, over a somewhat longer time frame (until September 20th), was 0.83% of position value.
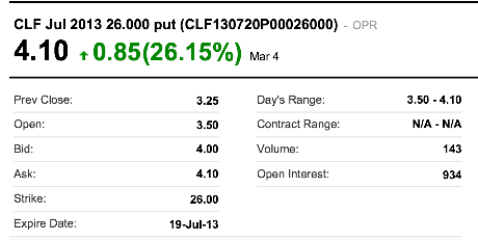
Those Puts On March 4th
How They Cushioned The Cliff Dive
Cliffs traded at $29.29 on February 13th. An investor who owned 1000 shares and bought the optimal puts to hedge it against a >20% drop that day had $29,290 in stock and an outlay of $2,030 on the puts (again, assuming, conservatively, that he bought the puts at the ask). $29,290 + $2,030 = $31,320.
As of Monday's close, his CLF shares were worth $23,780 and his options were worth $4,100: $23,780 + $4,100 = $27,880. So although CLF dropped about 23% from February 13th's close to March 4th's close, an investor who bought those puts at the close on the 13th was only down about 11% on his combined hedge + underlying stock position over the same time frame.
The Second Hedging Scenario
A CLF investor interested in hedging against the same, greater-than-20% decline between February 13th and July 19th, but who was also willing to cap his potential upside at 16% over that time frame, could have used the optimal collar** below to hedge instead.
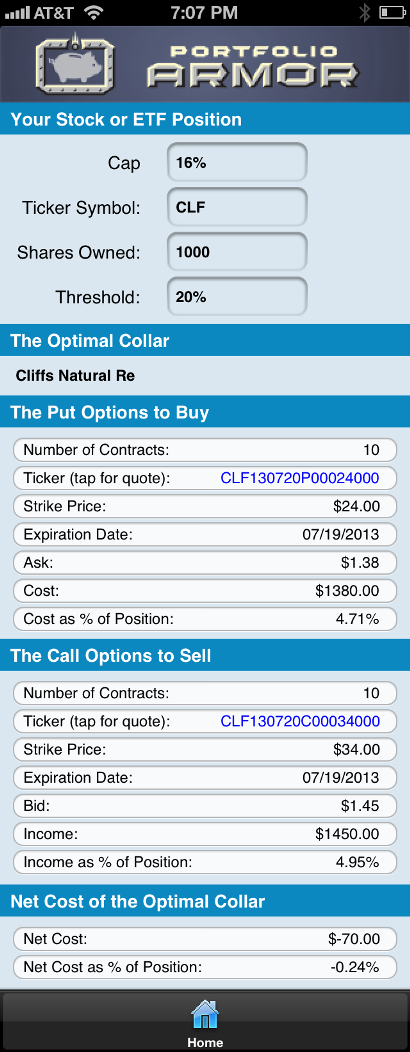
As you can see at the bottom of the screen capture above, the net cost of this optimal collar was negative -- meaning the CLF investor was getting paid to hedge in this case.
The Put Leg Of That Collar On Monday, March 4th
How That Collar Cushioned The Cliff Dive
An investor who owned 1000 shares and bought the optimal collar above to hedge it against a >20% drop that day had $29,290 in stock and an outlay of -$70 on the collar (because the income from selling the call leg slightly more than offset the cost of buying the put leg). $29,290 - $70 = $29,220.
As of Monday's close, his CLF shares were worth $23,780 and his put options were worth $2,880: $23,780 + $2,880 = $26,660. So although CLF dropped about 23% from February 13th's close to March 4th's close, an investor who bought those puts at the close on the 13th was only be down about 8.8% on his combined hedge + underlying stock position over the same time frame.
More Protection Than Promised
Recall that in both hedging scenarios -- the optimal put and the optimal collar -- our hypothetical investors were looking to hedge against greater-than-20% declines. Because the puts in both cases had plenty of time value in addition to intrinsic value as of Monday's close, they offered more protection than that.
*Optimal puts are the ones that will give you the level of protection you want at the lowest possible cost. Portfolio Armor uses an algorithm developed by a finance Ph.D to sort through and analyze all of the available puts for your stocks and ETFs, scanning for the optimal ones.
**Optimal collars are the ones that will give you the level of protection you want at the lowest net cost, while not limiting your potential upside by more than you specify. The algorithm to scan for optimal collars was developed in conjunction with a post-doctoral fellow in the financial engineering department at Princeton University.
The screen captures above come from the latest build of the soon-to-come 2.0 version of the Portfolio Armor iOS app. Optimal collar capability will be available as an in-app subscription in the 2.0 version of the app.
© 2024 Benzinga.com. Benzinga does not provide investment advice. All rights reserved.
Comments
Trade confidently with insights and alerts from analyst ratings, free reports and breaking news that affects the stocks you care about.

