
Shiba Inu SHIB/USD was sliding over 2% during Monday’s 24-hour trading session, rejecting the eight-day exponential moving average (EMA) as resistance.
The crypto sector has been in a state of limbo lately, trading sideways and not showing signs of whether the consolidation is accumulation before a potential bull run or distribution prior to another plunge.
Shiba Inu, dubbed "the Dogecoin Killer," has been trading within Sunday’s 24-hour range, which has settled the crypto into an inside bar pattern on the chart.
An inside bar pattern indicates a period of consolidation and is usually followed by a continuation move in the direction of the current trend.
An inside bar pattern has more validity on larger time frames (four-hour chart or larger). The pattern has a minimum of two candlesticks and consists of a mother bar (the first candlestick in the pattern) followed by one or more subsequent candles. The subsequent candle(s) must be completely inside the range of the mother bar and each is called an "inside bar."
A double, or triple inside bar can be more powerful than a single inside bar. After the break of an inside bar pattern, traders want to watch for high volume for confirmation the pattern was recognized.
- Bullish traders will want to search for inside bar patterns on stocks that are in an uptrend. Some traders may take a position during the inside bar prior to the break while other aggressive traders will take a position after the break of the pattern.
- For bearish traders, finding an inside bar pattern on a stock that's in a downtrend will be key. Like bullish traders, bears have two options of where to take a position to play the break of the pattern. For bearish traders, the pattern is invalidated if the stock rises above the highest range of the mother candle.
Want direct analysis? Find me in the BZ Pro lounge! Click here for a free trial.
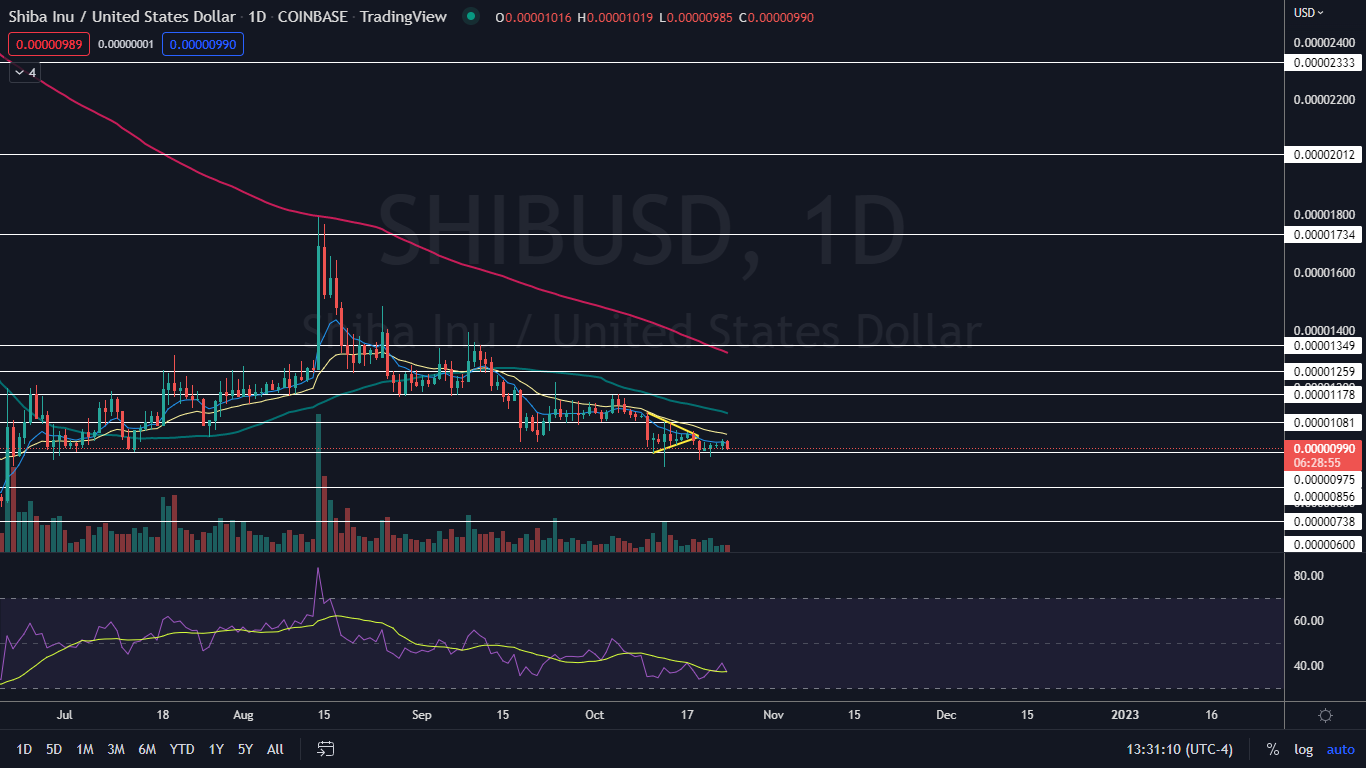
The Shiba Inu Chart: Shiba Inu attempted to break both up and down from Sunday’s daily candlestick on Monday but was unable. The crypto was trading on lower-than-average volume, which indicates a current lack of interest in the token.
- Lower-than-average volume, especially for a prolonged period of time, is often followed by a burst of volume, which breaks a stock or crypto up or down from its horizontal phase. Shiba Inu’s inside bar is neutral due because the crypto isn’t showing any clear direction but traders can watch for the token to eventually break up or down from the inside bar on higher-than-average volume to gauge future direction.
- The eight-day EMA has been holding the crypto down since Oct. 6, which indicates the area is under heavy resistance. If Shiba Inu breaks up bullishly from the inside bar pattern, the crypto will regain the eight-day EMA, which would give bulls more confidence going forward.
- Shiba Inu has resistance above at $0.00001081 and $0.00001178 and support below at $0.00000975 and $0.00000876.
 See Also: Dogecoin Layer 2 Crypto Dogechain (DC) Shoots Up 257% In A Week
© 2024 Benzinga.com. Benzinga does not provide investment advice. All rights reserved.
Comments
Trade confidently with insights and alerts from analyst ratings, free reports and breaking news that affects the stocks you care about.

